

Timbercreek Financial (58O) Q2 2026 Earnings Report
DE:58O Q2 2026 EPS Results
- Actual EPS
- EUR 0.06
- Consensus EPS
- EUR 0.11
- Beat/Miss
- Missed by -EUR 0.05
- One Year Ago EPS
- EUR 0.10
DE:58O Q2 2026 Revenue Results
- Actual Revenue
- EUR 25.22M
- Expected Revenue
- EUR 16.52M
- Beat/Miss
- Beat by +EUR 8.70M
- YoY Revenue Growth
- +8.32%
Earnings Announcement Details
- Quarter
- Q2 2026
- Date
- 07/29/2026
- Time
- After Close
- Conference Call
- Wednesday, July 29, 2026
Timbercreek Financial's next earnings date is estimated for November 11, 2026, based on past reporting schedules.
Q2 2026 Earnings Call Audio
No earnings call audio is available for this earnings event.
Q2 2026 Earnings Slide Deck
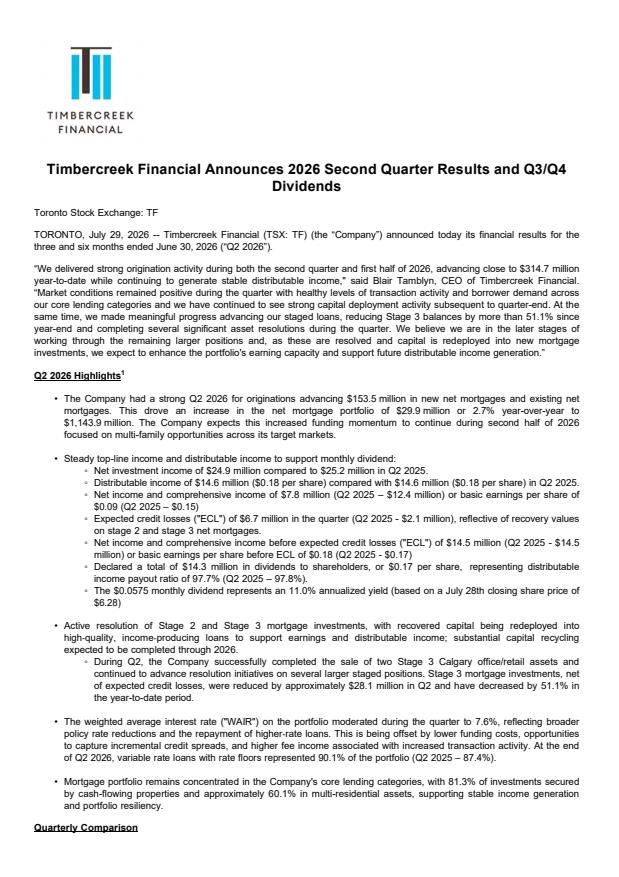
Q2 2026 Earnings Call Summary
The call conveyed a cautiously positive operational picture: distributable income and net investment income were stable, originations and syndication activity were strong, and management made meaningful progress reducing Stage 3 exposure (>51% reduction since year-end). However, IFRS earnings were materially impacted by increased expected credit losses and valuation adjustments (net income fell ~37%), and roughly ~20% of the portfolio remains in Stage 2/3 with near-term PCLs potentially elevated. Management emphasized active resolution plans and the ability to redeploy recovered capital into performing loans, supporting a constructive outlook.
Management guided that the focus remains on supporting the monthly dividend and redeploying capital as stage loans resolve, citing Q2 distributable income of $14.6M ($0.18/share) with a payout ratio of 97.7%, net investment income of $24.9M, net income and comprehensive income of $7.8M (net income before expected credit losses $14.5M or $0.18/share), and historical quarterly distributable income averaging ~$0.19/share (range $0.17–$0.21); portfolio and activity metrics included net mortgage investments of ~$1.14B at quarter end (portfolio balance ~$1.24B after ~$100M deployed in July), $154M advanced in Q2 (~$315M YTD across 24 new investments, 11 in Q2), repayments of ~ $250M in Q2, ~60% of investments in multi‑res, just over 81% in cash‑flowing properties, ~90% floating‑rate loans (most at contractual floors), 97% of invested capital concentrated in Ontario/BC/Quebec/Alberta, Stage 3 balances down >51% since year‑end with most remaining Stage 2/3 positions expected to be resolved by year‑end, leverage ~48%, and ongoing expectations for robust H2 originations and fee/syndication support to earnings.
- Stable Distributable Income and Dividend SupportDistributable income of $14.6 million ($0.18 per share) in Q2, essentially unchanged from Q1 ($14.5 million) — a QoQ increase of ~0.7%. Payout ratio remained within target at 97.7%, and management reiterated that distributable income supports the monthly dividend.
- Solid Net Investment IncomeNet investment income for the quarter was $24.9 million, reported as essentially unchanged versus the prior quarter and the comparative period, supported by portfolio growth, fee generation and lower funding costs.
- Strong Origination Activity and PipelineAdvanced approximately $154 million in Q2 (11 new mortgage investments plus additional advances). Year-to-date originations were ~ $315 million across 24 new investments, described as a meaningful increase over the same period last year. Management reported an active pipeline and additional ~$100 million net deployed in early July resulting in a current portfolio balance of ~ $1.24 billion.
- Reduction in Stage 3 ExposureStage 3 balances have declined by more than 51% since year-end, reflecting completed exits and asset-specific resolution strategies. Management expects most remaining stage positions to have better visibility to resolution by year-end.
- Portfolio Composition and Rate ProtectionsPortfolio remains concentrated in income-producing real estate: ~81% in cash-flowing properties, ~60% in multi-residential assets, and ~97% of invested capital in Ontario, B.C., Quebec and Alberta. Approximately 90% of the portfolio is floating-rate with contractual floors, and substantially all loans are currently operating at floor rates — providing support to yields despite a lower benchmark rate environment.
- Syndication, Repayments and Capacity RecyclingRepayments totaled ~ $250 million in the quarter, providing capital recycling and fee income. Syndication activity remained strong, serving as a yield enhancement and capacity tool and enabling the firm to redeploy capital into new originations.
- Modest Balance Sheet GrowthNet mortgage investments were ~ $1.14 billion at quarter-end, an increase of ~ $30 million year-over-year (approx +2.7%). Pro-forma/early July deployments increased the portfolio to ~ $1.24 billion.
DE:58O Earnings History
| Report Date | Fiscal Quarter | Forecast / EPS | Last Year's EPS | EPS YoY Change | Press Release |
|---|---|---|---|---|---|
| Nov 11, 2026 | 2026 (Q3) | 0.09- | 0.06 | ― | ― |
| Jul 29, 2026 | 2026 (Q2) | 0.110.06 | 0.1 | -40.00% (-0.04) | |
| May 05, 2026 | 2026 (Q1) | 0.110.08 | 0.12 | -27.78% (-0.03) | |
| Feb 25, 2026 | 2025 (Q4) | 0.11-0.01 | 0.02 | -133.33% (-0.03) | |
| Oct 29, 2025 | 2025 (Q3) | 0.110.06 | 0.11 | -41.18% (-0.04) | |
| Jul 30, 2025 | 2025 (Q2) | 0.110.10 | 0.12 | -21.05% (-0.03) | |
| May 05, 2025 | 2025 (Q1) | 0.110.12 | 0.11 | 5.88% (+0.01) | |
| Feb 26, 2025 | 2024 (Q4) | 0.100.02 | 0.12 | -83.33% (-0.10) | |
| Oct 30, 2024 | 2024 (Q3) | 0.110.11 | 0.13 | -15.00% (-0.02) | |
| Jul 31, 2024 | 2024 (Q2) | 0.120.12 | 0.13 | -5.00% (-0.01) |
The table shows recent earnings report dates and whether the forecast was beat or missed. See the change in forecast and EPS from the previous year.
