


Compania Cervecerias Unidas SA earnings date
Want to see CCU full AI Analyst Report?
Compania Cervecerias Unidas SA (CCU) Q2 2026 Earnings Report
CCU Q2 2026 EPS Results
- Actual EPS
- -$0.11
- Consensus EPS
- -$0.11
- Beat/Miss
- Missed by -$0.01
- One Year Ago EPS
- -$0.06
CCU Q2 2026 Revenue Results
- Actual Revenue
- $674.59M
- Expected Revenue
- $596.15M
- Beat/Miss
- Beat by +$78.44M
- YoY Revenue Growth
- +10.13%
Earnings Announcement Details
- Quarter
- Q2 2026
- Date
- 05/06/2026
- Time
- After Close
- Conference Call
- Wednesday, May 6, 2026
Compania Cervecerias Unidas SA's next earnings date is estimated for March 2, 2027, based on past reporting schedules.
Q2 2026 Earnings Call Audio
No earnings call audio is available for this earnings event.
Q2 2026 Earnings Slide Deck
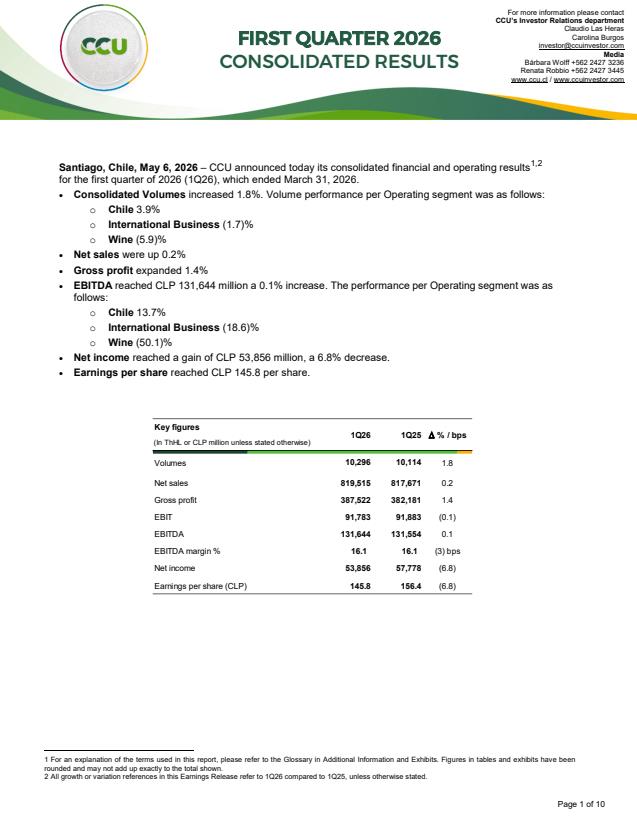
Q2 2026 Earnings Call Summary
The call presented a materially positive operational quarter at the consolidated level — highlighted by a 59.4% increase in consolidated EBITDA, strong performance and margin expansion in Chile, improved results in the international business, and strategic progress including full ownership of the water JV and a new company-wide strategic agenda. Offsetting these positives were significant weaknesses in the wine segment (large revenue, margin and EBITDA declines), a substantial one-time impairment related to Bolivia (CLP 6,068 million) that hurt net income, restructuring charges, distribution cost pressures from higher oil prices, and a rise in leverage after the water acquisition. Management emphasized efficiency initiatives, digital transformation, and a medium-term plan to drive synergies and margin recovery, while noting ongoing macro uncertainty in Argentina and challenges in Bolivia.
Management’s guidance focused on executing the new “Vamos por Más” 4‑pillar strategy and a new 4‑year plan to 2030 with KPIs, keeping the hedging policy unchanged and maintaining a dividend policy to distribute at least 50% of net income; they expect a gradual recovery in Argentina volumes in H2‑2026 (month‑on‑month improvement since March), see the Chile water industry expanding low double‑digit as of June 2026, and will pursue synergies, restructuring and high‑margin innovation (including RTD expansion). Key metrics cited: consolidated Q2 — net sales +4.8%, average prices +6.4% (CLP), volumes -1.5%, gross profit +6.8% (+76 bps margin), MSD&A +3.3% (‑62 bps as % of sales), EBITDA +59.4%; Chile segment — net sales +1.5%, volumes +2.5%, avg prices -1%, gross profit +9.4%, EBITDA +26.2% (EBITDA margin +264 bps); International — net sales +15.7%, avg prices +24.9%, volumes -7.4%, gross profit +20.8%, EBITDA loss reduced 25.8%; Wine — revenue -14.1%, volumes -13.7%, avg prices -0.5%, gross profit -26.9%, EBITDA -61.9%. They disclosed restructuring charges of CLP 1,408m (Argentina) and CLP 1,633m (wine), an earlier nonrecurring impairment of CLP 6,068m (Q2‑2025), completion of the Nestlé Chile water transaction to reach 100% ownership (accretive), and that net debt/EBITDA moved from ~1.7x to ~2.4x with a target range around 1.5–2.5x over time.
- Strong Consolidated EBITDA GrowthConsolidated EBITDA expanded 59.4% year-over-year, driven by strong operational performance in Chile and improvements in the international business.
- Chile Segment OutperformanceChile operating segment EBITDA increased 26.2%; top line rose 1.5% with volumes up 2.5% (gaining market share). Gross profit in Chile grew 9.4% and EBITDA margin expanded ~264 basis points. Nonalcoholic categories grew mid-single digits and flavored low-alcohol RTD products posted double-digit volume growth, representing 8.3% of total alcohol in the segment as of June 2026.
- Revenue Growth and Price ManagementConsolidated net sales grew 4.8% year-over-year, largely driven by a 6.4% increase in average prices in CLP, reflecting revenue management initiatives across operating segments despite a 1.5% decline in consolidated volumes.
- International Business Loss ReductionInternational business net sales rose 15.7% (helped by 24.9% higher average prices in CLP) and gross profit increased 20.8%. The segment posted a 25.8% reduction in EBITDA loss versus Q2 2025, improving the overall international performance.
- Full Ownership of Water JV (Aguas Nestlé)Acquired the remaining 49% stake previously held by Nestlé Chile in Aguas Nestlé, achieving 100% ownership. Management expects this to strengthen leadership in Chile's water market (expanding low double digits) and be accretive to earnings going forward.
- Gross Profit and Margin ImprovementsConsolidated gross profit grew 6.8% and consolidated gross margin improved by ~76 basis points, aided by a ~5% appreciation of the Chilean peso vs. USD that reduced U.S. dollar-denominated direct costs.
- Colombia MomentumMain joint venture/associate in Colombia delivered mid-teens volume growth in the quarter; management views Colombia as a core growth market and plans to continue building brand equity and scale.
- Strategic Plan and Digital/Operational AgendaManagement introduced 'Vamos por Más' — a strategic agenda focused on (1) sharpening business focus, (2) driving operational synergies, (3) increasing agility, and (4) accelerating transformation (digital tools, control towers, end-to-end integration) to support profitable growth and margin recovery.
CCU Earnings History
| Report Date | Fiscal Quarter | Forecast / EPS | Last Year's EPS | EPS YoY Change | Press Release |
|---|---|---|---|---|---|
| Mar 02, 2027 | 2026 (Q4) | ―- | 0.3 | ― | ― |
| Nov 11, 2026 | 2026 (Q3) | 0.090.09 | 83.88 | -99.89% (-83.79) | |
| May 06, 2026 | 2026 (Q1) | 0.240.29 | 0.31 | -6.79% (-0.02) | |
| May 06, 2026 | 2026 (Q2) | -0.11-0.11 | -0.06 | -84.54% (-0.05) | |
| Feb 24, 2026 | 2025 (Q4) | 0.370.30 | 0.4 | -25.70% (-0.10) | |
| Sep 30, 2025 | 2025 (Q3) | 0.090.08 | 0.16 | -47.54% (-0.08) | |
| Jun 30, 2025 | 2025 (Q2) | -0.05-0.06 | 0.03 | -287.56% (-0.09) | |
| May 07, 2025 | 2025 (Q1) | 0.320.31 | 0.28 | 10.66% (+0.03) | |
| Feb 25, 2025 | 2024 (Q4) | 0.280.40 | 0.23 | 77.71% (+0.18) | |
| Nov 06, 2024 | 2024 (Q3) | 0.080.16 | 0.05 | 210.97% (+0.11) |
The table shows recent earnings report dates and whether the forecast was beat or missed. See the change in forecast and EPS from the previous year.
