

Want to see REG full AI Analyst Report?
Regency Centers (REG) Q2 2026 Earnings Report
REG Q2 2026 EPS Results
- Actual EPS
- $0.61
- Consensus EPS
- $0.59
- Beat/Miss
- Beat by +$0.02
- One Year Ago EPS
- $0.56
REG Q2 2026 Revenue Results
- Actual Revenue
- $415.29M
- Expected Revenue
- $411.07M
- Beat/Miss
- Beat by +$4.22M
- YoY Revenue Growth
- +8.60%
Earnings Announcement Details
- Quarter
- Q2 2026
- Date
- 07/29/2026
- Time
- After Close
- Conference Call
- Wednesday, July 29, 2026
Regency Centers's next earnings date is estimated for November 5, 2026, based on past reporting schedules.
Q2 2026 Earnings Call Audio
Q2 2026 Earnings Slide Deck
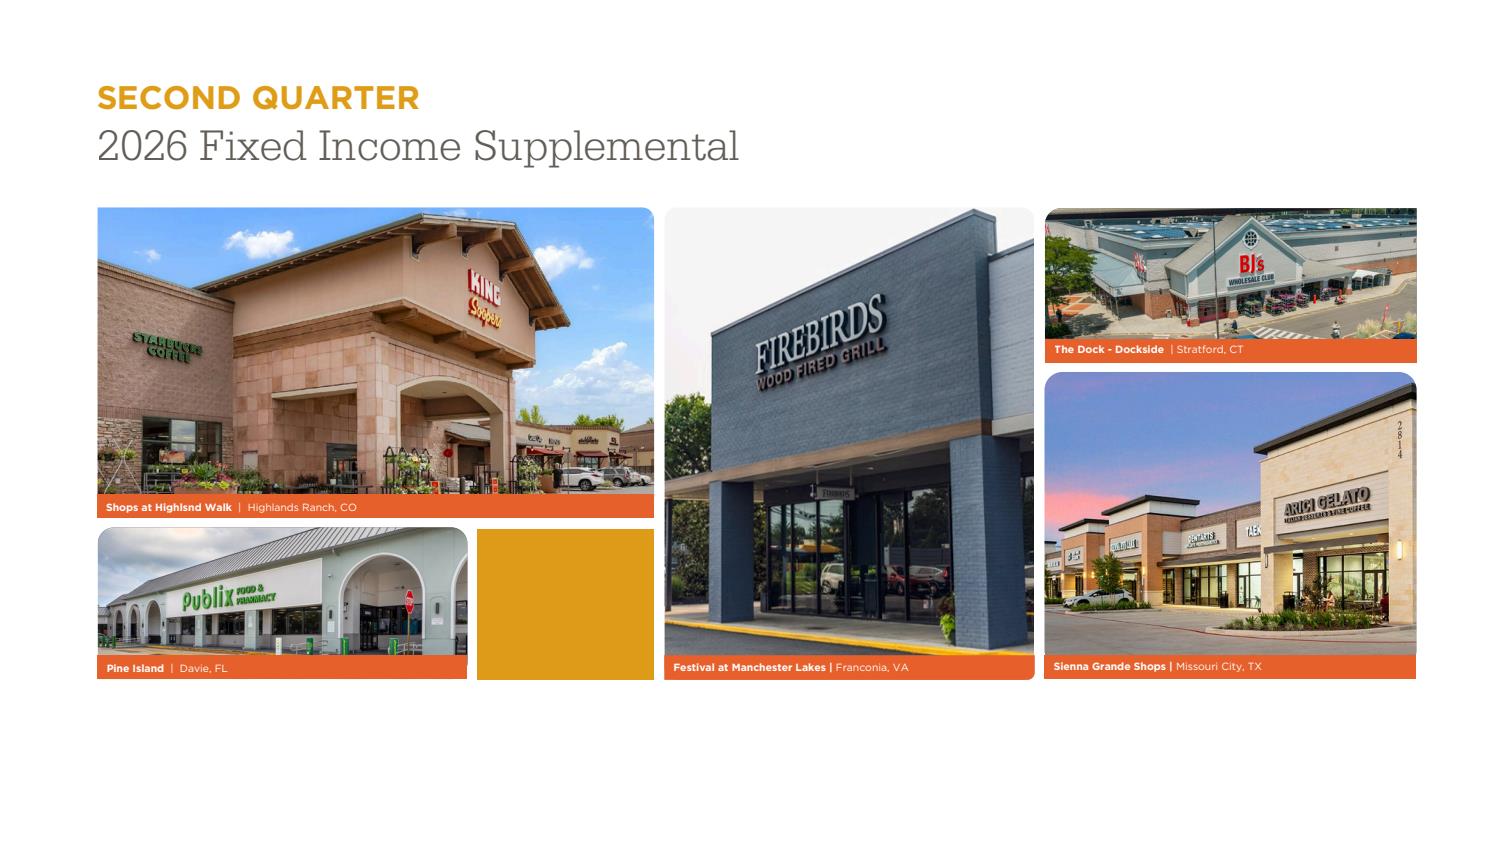
Q2 2026 Earnings Call Summary
The call conveyed overall strength across operations and growth engines: robust leasing demand, healthy rent spreads, high occupancy and improved expense recoveries drove solid same-property NOI and a raised full-year outlook. The company emphasized a growing, accretive development pipeline, a strong balance sheet and ample liquidity. Headwinds include noncash FFO adjustments from lease accounting changes, competitive acquisition markets with cap rate compression, construction cost volatility, and slower anchor escalator recovery. On balance, positive operating momentum and upgraded guidance outweigh these challenges.
Management raised full‑year guidance: same‑property NOI was increased by ~40 bps at the midpoint and total NOI is now expected in the mid‑6% range, while core operating EPS growth is now expected to exceed 5% (about a $0.03 midpoint uplift); Q2 same‑property NOI was 3.8%, cash rent spreads were >10% (GAAP spreads ~20%), same‑property leased rate is ~97%, retention ~84%, commenced occupancy rose ~20 bps (average commence occupancy cited near 94–94.5%), and SNO spread is ~240 bps versus a historical ~180 bps. On the investment side, 2026 starts are expected to approach $400M (YTD starts >$140M), a $680M in‑process pipeline is expected to yield ~9% blended returns (in‑process ~80% leased) and ground‑up yields are north of ~7%. Balance sheet and liquidity metrics include free cash flow of roughly $180M, leverage comfortably within the 5.0–5.5x target (at the low end today), and nearly full availability on a $1.5B revolver; management also noted an atypical Q3 lease termination fee (raising term fees) largely offset by lower non‑cash revenue from below‑market rent amortization and higher straight‑line rent reserves.
- Same-Property NOI Growth and Strong Operating FundamentalsReported same-property NOI growth of 3.8% in the quarter driven primarily by base rent growth; raised full-year same-property NOI guidance by 40 basis points at the midpoint.
- Occupancy, Leasing Momentum and RetentionSame-property leased rate nearly 97%; commenced occupancy improved (management referenced ~94.5% commence occupancy and a 20-basis-point increase this quarter); tenant retention of 84% and accounts receivable below historical averages.
- Robust Rent Spreads and Embedded EscalatorsAchieved cash rent spreads above 10% and GAAP spreads of nearly 20%; most new shop leases include annual escalators (3%+ in >80% of new shop leases) supporting sustainable base rent growth.
- Raised Earnings and NOI OutlookRaised full-year outlook to total NOI growth in the mid-6% area and now expect core operating earnings per share growth to exceed 5%; a healthy 1.5¢ contribution from lease termination fees was highlighted as incremental to guidance.
- Development and Redevelopment GrowthNational ground-up development program expected to approach $400 million of starts in 2026; year-to-date starts >$140 million; in-process pipeline ~$680 million with expected blended returns of ~9% and in-process development ~80% leased.
- Disciplined Capital Allocation and Balance Sheet StrengthFree cash flow roughly $180 million for the year; leverage comfortably within target range (5.0–5.5x, at the lower end); near-full availability on $1.5 billion revolver enabling funding of pipelines and opportunistic acquisitions.
- Ancillary Income and ESG ProgressAncillary income run-rate of about $35 million per year and growing (includes solar, EV revenue, fees and marketing); published corporate responsibility report and continuing investment in solar and other sustainability initiatives.
- High-Quality Leasing Mix and Tenant DemandBroad-based leasing demand across grocers, health & wellness, restaurants, personal services and value retailers; examples of early openings accelerating rent commencement (Trader Joe's, Kroger) and strong pipeline leasing activity.
REG Earnings History
| Report Date | Fiscal Quarter | Forecast / EPS | Last Year's EPS | EPS YoY Change | Press Release |
|---|---|---|---|---|---|
| Nov 05, 2026 | 2026 (Q3) | 0.61- | 0.58 | ― | ― |
| Jul 29, 2026 | 2026 (Q2) | 0.590.61 | 0.56 | 8.93% (+0.05) | |
| Apr 29, 2026 | 2026 (Q1) | 0.620.68 | 0.58 | 17.24% (+0.10) | |
| Feb 05, 2026 | 2025 (Q4) | 0.581.09 | 0.46 | 136.96% (+0.63) | |
| Oct 28, 2025 | 2025 (Q3) | 0.560.58 | 0.54 | 7.41% (+0.04) | |
| Jul 29, 2025 | 2025 (Q2) | 0.550.56 | 0.54 | 3.70% (+0.02) | |
| Apr 29, 2025 | 2025 (Q1) | 0.560.58 | 0.58 | 0.00% (+0.00) | |
| Feb 06, 2025 | 2024 (Q4) | 0.480.46 | 0.46 | 0.44% (+0.00) | |
| Oct 28, 2024 | 2024 (Q3) | 0.460.54 | 0.5 | 8.43% (+0.04) | |
| Aug 01, 2024 | 2024 (Q2) | 0.460.54 | 0.51 | 5.26% (+0.03) |
The table shows recent earnings report dates and whether the forecast was beat or missed. See the change in forecast and EPS from the previous year.
