

Berkshire Hathaway B (BRKB) Stock Price & Analysis
BRKB Stock Chart & Stats
- Day’s Range
- MXN 10,150.00 - MXN 10,359.99
- 52-Week Range
- MXN 8,056.00 - MXN 10,359.99
- Previous Close
- MXN 10,227.01
- Volume
- 342
- Average Volume (3M)
- 1,546
- Market Cap
- MXN 21.84T
- Enterprise Value
- MXN 844.30B
- Total Cash (Recent Filing)
- MXN 365.51B
- Total Debt (Recent Filing)
- MXN 129.37B
- Price to Earnings (P/E)
- 13.7
- Beta
- -0.12
- Next Earnings
- Nov 02, 2026 (Est.)
- EPS Estimate
- 110.57
- Next Dividend Ex-Date
- N/A
- Dividend Yield
- N/A
Bulls Say, Bears Say
Bulls Say
Diversified Earnings Base And Insurance Float
Berkshire’s broad collection of operating businesses and insurance activities reduces dependence on any single sector. Its ability to invest policyholder float adds a durable capital-allocation advantage and supports resilience across economic cycles.
Conservative Balance Sheet
Strong capitalization and low relative leverage provide financial flexibility for claims, investment commitments, acquisitions, and subsidiary funding. This conservative structure should help Berkshire absorb operating volatility without relying heavily on external financing.
Strong Current Profitability And Positive Free Cash Flow
Current earnings strength is supported by profitable operations rather than only asset values, while consistently positive cash generation improves internal funding capacity. Higher TTM free cash flow gives management resources to reinvest, acquire businesses, or strengthen liquidity.
Bears Say
Limited Top-line Growth
Berkshire’s scale and diversification support resilience, but limited revenue expansion may constrain long-term operating earnings growth. Without stronger demand or sustained contribution from acquisitions, future gains may depend more on margins and capital returns.
High Reported Earnings Volatility
Large year-to-year swings reduce earnings predictability and complicate assessment of underlying operating performance. Equity-market movements and insurance outcomes can materially affect reported results even when Berkshire’s capital position remains strong.
Uneven Cash Conversion And Insurance Cost Risks
Positive cash flow is a strength, but inconsistent conversion means reported profits do not always translate evenly into deployable cash. Cyclical insurance losses and rising cost categories could pressure margins and reduce capital available for reinvestment.







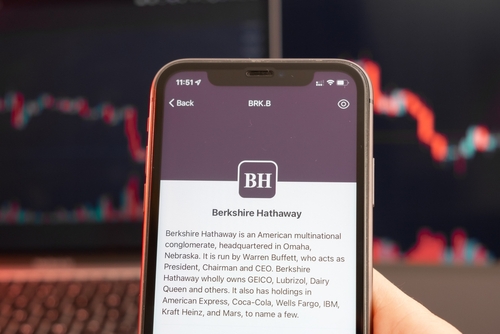


BRKB FAQ
What was Berkshire Hathaway B’s price range in the past 12 months?
What is Berkshire Hathaway B’s market cap?
When is Berkshire Hathaway B’s upcoming earnings report date?
How were Berkshire Hathaway B’s earnings last quarter?
Is Berkshire Hathaway B overvalued?
Does Berkshire Hathaway B pay dividends?
What is Berkshire Hathaway B’s EPS estimate?
How many shares outstanding does Berkshire Hathaway B have?
What happened to Berkshire Hathaway B’s price movement after its last earnings report?
Which hedge fund is a major shareholder of Berkshire Hathaway B?
What is the TipRanks Smart Score and how is it calculated?
Berkshire Hathaway B Stock Smart Score
Company Description
Berkshire Hathaway B
Berkshire Hathaway Inc., established in 1998 and headquartered in Omaha, Nebraska, operates as a vast global conglomerate with diverse business interests. Its core operations primarily encompass insurance, freight rail transportation, and utility services. The company provides a comprehensive suite of insurance and reinsurance products, including coverage for property, casualty, life, accident, and health. Across North America, it manages extensive railway networks dedicated to freight transport. Its utility division is responsible for generating, transmitting, storing, and distributing electricity sourced from various origins such as natural gas, coal, wind, solar, hydroelectric, nuclear, and geothermal energy. This segment also oversees natural gas infrastructure, including distribution networks, storage facilities, interstate pipelines, and liquefied natural gas (LNG) operations, alongside its interests in coal mining. Beyond these foundational sectors, Berkshire Hathaway boasts a significant manufacturing footprint. It produces a wide array of goods ranging from confectionery and specialty chemicals to metal cutting tools and components for both aerospace and power generation applications. Its manufacturing portfolio also extends to flooring products, insulation, roofing materials, engineered building components, paints, coatings, and bricks. The company is also involved in residential construction, offering both manufactured and site-built homes, supplemented by related lending and financial services. Its product offerings further include recreational vehicles, apparel, footwear, jewelry, custom picture framing, and alkaline batteries. On the industrial side, it manufactures specialized components like castings, forgings, fasteners, aerostructures, and precision parts, often utilizing advanced alloys such as cobalt, nickel, and titanium. Additionally, Berkshire Hathaway provides a variety of services, which include distributing electronic components, franchising and servicing quick-service restaurants, offering logistics, grocery, and foodservice distribution, as well as professional aviation training and shared aircraft ownership programs. Finally, the company maintains a substantial retail presence, selling an extensive selection of products such as automobiles, furniture, home appliances, electronics, computers, jewelry, and kitchenware, in addition to motorcycle clothing and equipment.
- Sector
- Financial
- Industry
- Insurance - Diversified
- CEO
- Gregory Edward Abel
- Employees
- 387,815
- Website
- www.berkshirehathaway.com
- Address
- 3555 Farnam Street, Omaha, NE, 68131, US
Berkshire Hathaway B (BRKB) Earnings & Revenues
BRKB Net sales Breakdown
- 20.69% Manufacturing
- 14.43% McLane
- 14.20% PTC
- 10.97% Service and retailing
- 39.76% Other

BRKB Stock 12 Month Forecast
Average Price Target
Technical Analysis
Overall Consensus
| Indicator | Bullish | Neutral | Bearish |
|---|---|---|---|
| Overall Consensus | 14 | 3 | 5 |
| Technical Analysis | 2 | 3 | 5 |
| Moving Averages | 12 | 0 | 0 |
