

Want to see KPELY full AI Analyst Report?
Keppel (KPELY) Q2 2026 Earnings Report
KPELY Q2 2026 EPS Results
- Actual EPS
- $0.13
- Consensus EPS
- $0.33
- Beat/Miss
- Missed by -$0.19
- One Year Ago EPS
- $0.37
KPELY Q2 2026 Revenue Results
- Actual Revenue
- $2.98B
- Expected Revenue
- $2.06B
- Beat/Miss
- Beat by +$923.30M
- YoY Revenue Growth
- +29.04%
Earnings Announcement Details
- Quarter
- Q2 2026
- Date
- 07/29/2026
- Time
- After Close
- Conference Call
- Wednesday, July 29, 2026
Keppel's next earnings date is estimated for February 4, 2027, based on past reporting schedules.
Q2 2026 Earnings Call Audio
Q2 2026 Earnings Slide Deck
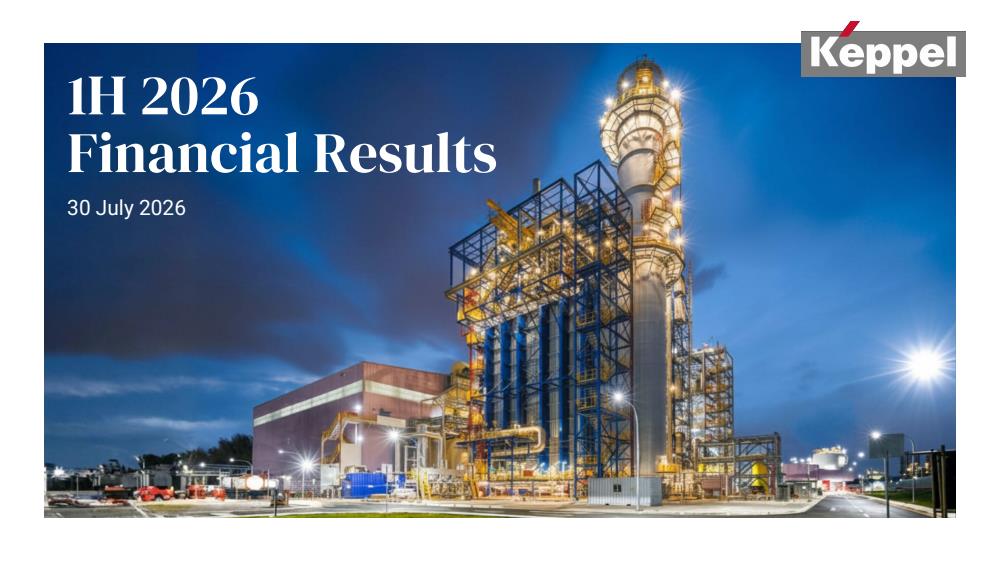
Q2 2026 Earnings Call Summary
The call presents a constructive transformation narrative: core (new Keppel) businesses are delivering stronger recurring income, significant FUM growth, substantial SSCI contributions and improved cash generation, while clear monetization plans and operational milestones (Sakra Cogen, Bifrost) support future earnings. These positives are partially offset by sizeable legacy noncore losses, rig impairments and higher consolidated leverage which depress headline profits and ROE. Management has a defined pathway to monetize noncore assets and is deploying scale in asset management, suggesting the near‑term negatives are largely legacy‑related and being actively managed.
Management guided that the “new Keppel” is tracking well: H1 2026 new‑Keppel net profit was SGD 530m (up 25% YoY) versus group net profit of SGD 155m after a SGD 375m non‑core loss; recurring income rose 13% YoY to SGD 467m and SSCI profits jumped to ~SGD 175m (from SGD 18m). Cash metrics improved—group free cash flow swung to a SGD 570m inflow (new Keppel FCF +SGD 244m)—and balance‑sheet ratios showed group net debt/EBITDA of 6.7x while new Keppel’s was ~1.4–1.5x; annualised ROE for new Keppel ~15% (group ROE 3.6%). Asset‑management scale hit SGD 106bn FUM (surpassing the SGD 100bn 2026 target), YTD asset monetizations announced ~SGD 1.7bn (on track to SGD 2–3bn FY), realized non‑core monetizations ~SGD 560m at end‑June, expected cash from first six rig divestments ~SGD 611m (additional ~SGD 1.3bn from remaining four rigs in 2027–28), and gross non‑core asset value ~SGD 13.7bn. Other notable metrics: interim dividend SGD 0.15/share; Sakra Cogen 600MW (+45% capacity) contributed to Power EBITDA growth of 9% YoY; group cost savings >SGD 100m annual run‑rate and M1 cost‑save target SGD 70m run‑rate by 2028 (SGD 4m YTD, SGD 10m target by end‑2026).
- New Keppel Net Profit Growth (Excluding Noncore)New Keppel net profit of SGD 530 million in 1H2026, up 25% year‑on‑year (from SGD 424 million), driven by sponsor stakes/co‑investments and higher recurring income.
- Funds Under Management Surpassed TargetFUM reached SGD 106 billion in July 2026, exceeding the end‑2026 target of SGD 100 billion ahead of schedule — an important inflection for asset management scale and fee income.
- Recurring Income ExpansionRecurring income rose 13% year‑on‑year to SGD 467 million in 1H2026, reflecting stronger asset management and operating platform cash flows.
- SSCI (Sponsor Stakes & Co‑Investments) JumpProfit from SSCI increased to SGD 175 million in 1H2026 (from SGD 18 million in 1H2025), a very large increase in contribution from sponsor stakes and co‑investments.
- Strong Free Cash Flow TurnaroundGroup free cash flow swung from an outflow of SGD 48 million in 1H2025 to an inflow of SGD 570 million in 1H2026 (improvement of ~SGD 618 million), underpinned by higher divestment proceeds.
- Successful Asset Monetization Progress and Fund CommitmentYTD asset monetization of ~SGD 1.7 billion announced; as at end‑June ~SGD 560 million realized. Secured a USD 1.5 billion commitment from Apollo to the Keppel Offshore Fund enabling monetization pathway for up to SGD 3.7 billion of legacy rigs.
- Key Operating Milestones — Power & DigitalKeppel Sakra Cogen (600 MW, hydrogen‑compatible) commenced operations (increasing generation capacity by ~45%) and Bifrost subsea cable fully commercialized; both now contributing to recurring income.
- Segmental Earnings StrengthInfrastructure segment net profit of SGD 538 million, up 55% year‑on‑year; Connectivity net profit SGD 77 million, up 54% year‑on‑year; Asset Management net profit SGD 247 million (more than double prior year).
- Asset Management Fee Momentum & Fund ActivityGenerated SGD 200 million of asset management fees in 1H2026; completed SGD 3.1 billion of acquisitions and SGD 2.4 billion of divestments across private funds and listed vehicles; large July fundraising (SGD 13.5 billion total raise activity) will boost fees going forward.
- Recurring Cost Savings and AI AdoptionOver SGD 100 million in recurring annual run‑rate cost savings from streamlining and AI initiatives; AI being embedded across investment, asset management and operations to improve margins and originate revenue.
- Interim Dividend MaintainedBoard declared interim cash dividend of SGD 0.15 per share for 1H2026, unchanged from prior year.
KPELY Earnings History
| Report Date | Fiscal Quarter | Forecast / EPS | Last Year's EPS | EPS YoY Change | Press Release |
|---|---|---|---|---|---|
| Feb 04, 2027 | 2026 (Q4) | 0.50- | 0.55 | ― | ― |
| Jul 29, 2026 | 2026 (Q2) | 0.330.13 | 0.37 | -64.42% (-0.24) | |
| Apr 16, 2026 | 2026 (Q1) | ―- | 0.43 | ― | |
| Feb 04, 2026 | 2025 (Q4) | 0.410.55 | 0.42 | 30.09% (+0.13) | |
| Jul 30, 2025 | 2025 (Q2) | 0.400.37 | 0.25 | 49.60% (+0.12) | |
| Apr 23, 2025 | 2025 (Q1) | ―- | 0.36 | ― | |
| Feb 04, 2025 | 2024 (Q4) | 0.380.42 | 0.36 | 16.90% (+0.06) | |
| Oct 17, 2024 | 2024 (Q3) | ―- | 0.56 | ― | |
| Jul 31, 2024 | 2024 (Q2) | ―0.25 | 0.36 | -30.73% (-0.11) | |
| Apr 24, 2024 | 2024 (Q1) | ―- | 0.23 | ― |
The table shows recent earnings report dates and whether the forecast was beat or missed. See the change in forecast and EPS from the previous year.
