Working with TipRanks
Follow Us


Stocks
ETFs
Options
Commodities
Crypto
Currency
Research Tools
Calendars
Economic Indicators
Calculators
Education
About Us
Working with TipRanks
Follow Us
Advanced Micro Devices (GB:0QZD)
LSE:0QZD
RESEARCH TOOLSreports
Advanced Micro Devices (0QZD) Share Price & Analysis
0 Followers
0QZD Stock Chart & Stats
Day’s Range$0 - $0
52-Week Range$81.11 - $227.28
Previous Close$154.28
Volume156.71K
Average Volume (3M)344.07K
Market Cap
$250.63B
Enterprise Value$247.86B
Total Cash (Recent Filing)$5.77B
Total Debt (Recent Filing)$3.00B
Price to Earnings (P/E)294.8
Beta0.80
Next Earnings
Apr 30, 2024EPS Estimate
$0.62Next Dividend Ex-DateN/A
Dividend YieldN/A
Share Statistics
EPS (TTM)0.52
Shares Outstanding1,615,786,841
10 Day Avg. Volume73,506
30 Day Avg. Volume344,074
Standard Deviation0.17
R-Squared0.06
Alpha0.07
Financial Highlights & Ratios
Price to Book (P/B)24.24
Price to Sales (P/S)22.34
Price to Cash Flow (P/CF)163.30
P/FCF Ratio231.30
Enterprise Value/Market CapN/A
Enterprise Value/Revenue10.93
Enterprise Value/Gross Profit23.70
Enterprise Value/Ebitda76.19
Forecast
1Y Price Target
$202.81Price Target Upside31.46% Upside
Rating ConsensusStrong Buy
Number of Analyst Covering35
Advanced Micro Devices News


Bulls Say, Bears Say
Bulls Say
Financial Performance & Analyst ExpectationsAnalysts are upgrading AMD's stock to a Buy rating and increasing the target price, signalling confidence in the company's financial future and its ability to capitalize on a 'multi-billion dollar growth opportunity' in AI.
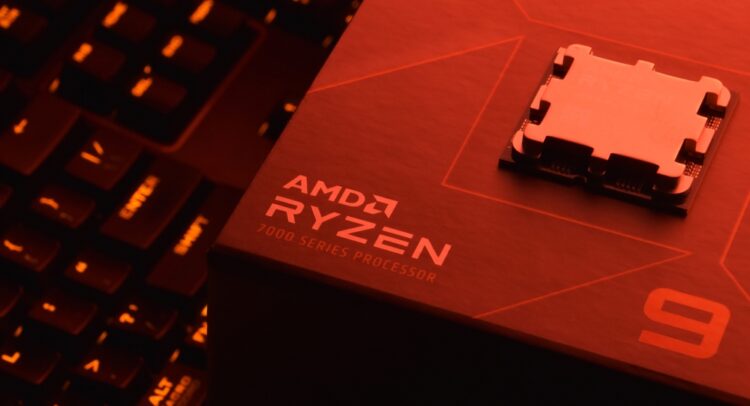
Market Share & Product ImprovementAMD's Ryzen 7000 processor represents a significant leap over its predecessor, outperforming Intel's 12th Gen Alder Lake CPUs in efficiency, which supports the company's growing processor market share, now at 31.3%.
Strategic Acquisitions & Revenue SynergiesFollowing the strategic acquisition of Xilinx, AMD is poised for over $10 billion in revenue synergies, showcasing the company's potential for substantial revenue growth and market expansion.
Bears Say
Financial PerformanceAMD's 2023 Client revenue at $4.651B, -25% y/y, reflects units shipped at -12% y/y; blended ASP ($/unit) at -16% y/y.
Guidance And ExpectationsThe midpoint of 1Q24 revenue guidance of $5.40 billion (down 12.5% sequentially) is below previous estimate of $5.60 billion and consensus of $5.73 billion.
Market Share And CompetitionRisks include x86 share loss to homegrown hyperscale CPUs and GPU/accelerators, aggressive pricing by INTC in low-end PC CPUs limiting OpM leverage, and potential mis-execution on MPU/GPU product launches.
---
Ownership Overview
21.00% Insiders
19.40% Mutual Funds
23.84% Other Institutional Investors
35.76% Public Companies and
Individual Investors
Website Traffic
The estimated number of people who visited one or more of the websites owned by Advanced Micro Devices
Desktop Users
Mobile Users
0QZD FAQ
What was Advanced Micro Devices’s price range in the past 12 months?
Advanced Micro Devices lowest share price was $81.11 and its highest was $227.28 in the past 12 months.
What is Advanced Micro Devices’s market cap?
Currently, no data Available
When is Advanced Micro Devices’s upcoming earnings report date?
Advanced Micro Devices’s upcoming earnings report date is Apr 30, 2024 which is in 10 days.
How were Advanced Micro Devices’s earnings last quarter?
Advanced Micro Devices released its earnings results on Jan 30, 2024. The company reported $0.77 earnings per share for the quarter, missing the consensus estimate of $0.774 by -$0.004.
Is Advanced Micro Devices overvalued?
According to Wall Street analysts Advanced Micro Devices’s price is currently Undervalued.
Does Advanced Micro Devices pay dividends?
Advanced Micro Devices does not currently pay dividends.
What is Advanced Micro Devices’s EPS estimate?
Advanced Micro Devices’s EPS estimate is $0.62.
How many shares outstanding does Advanced Micro Devices have?
Advanced Micro Devices has 1,616,140,000 shares outstanding.
What happened to Advanced Micro Devices’s price movement after its last earnings report?
Advanced Micro Devices reported an EPS of $0.77 in its last earnings report, missing expectations of $0.774. Following the earnings report the stock price went down -0.872%.
Which hedge fund is a major shareholder of Advanced Micro Devices?
Among the largest hedge funds holding Advanced Micro Devices’s share is Fisher Asset Management LLC. It holds Advanced Micro Devices’s shares valued at 4B.
---
Advanced Micro Devices Stock Smart Score
Outperform
1
2
3
4
5
6
7
8
9
10
Analyst Consensus
Strong Buy
Average Price Target:
$202.81 (31.46% Upside)
$202.81 (31.46% Upside)
Blogger Sentiment
Bullish
GB:0QZD Sentiment 71%
Sector Average 69%
Sector Average 69%
Insider Transactions
Sold Shares
Worth $26.2M over
the Last 3 Months
the Last 3 Months
News Sentiment
Very Bullish
Bullish news 91%
Bearish news 9%
Bearish news 9%
Technicals
SMA
Positive
20 days / 200 days
Momentum
71.38%
12-Months-Change
Fundamentals
Return on Equity
1.54%
Trailing 12-Months
Asset Growth
0.45%
Trailing 12-Months
Company Description
Advanced Micro Devices
Founded in 1969, California-based Advanced Micro Devices, Inc. is America's leading semiconductor company. The Computing and Graphics segment includes desktop and notebook processors and chipsets, discrete and integrated graphics processing units, data center and professional GPUs and development services. The Enterprise, Embedded and Semi-Custom segment includes server and embedded processors, semi-custom System-on-Chip products, development services and technology for game consoles.
---
0QZD Company Deck
---
0QZD Earnings Call
Q4 2024
0:00 / 0:00
---
0QZD Revenue Breakdown
28.64% Data Center
27.39% Gaming
23.46% Embedded
20.51% Client
---
0QZD Stock 12 Months Forecast
Average Price Target
$202.81
▲(31.46% Upside)
Technical Analysis
Best Analysts Covering 0QZD
1 Year
1 Year Success Rate
19/21 ratings generated profit
1 Year Average Return
+34.86%
reiterated a buy rating 15 days ago
Copying Harsh Kumar's trades and holding each position for 1 Year would result in 90.48% of your transactions generating a profit, with an average return of +34.86% per trade.
---