

Want to see FSBC full AI Analyst Report?
Five Star (FSBC) Q3 2026 Earnings Report
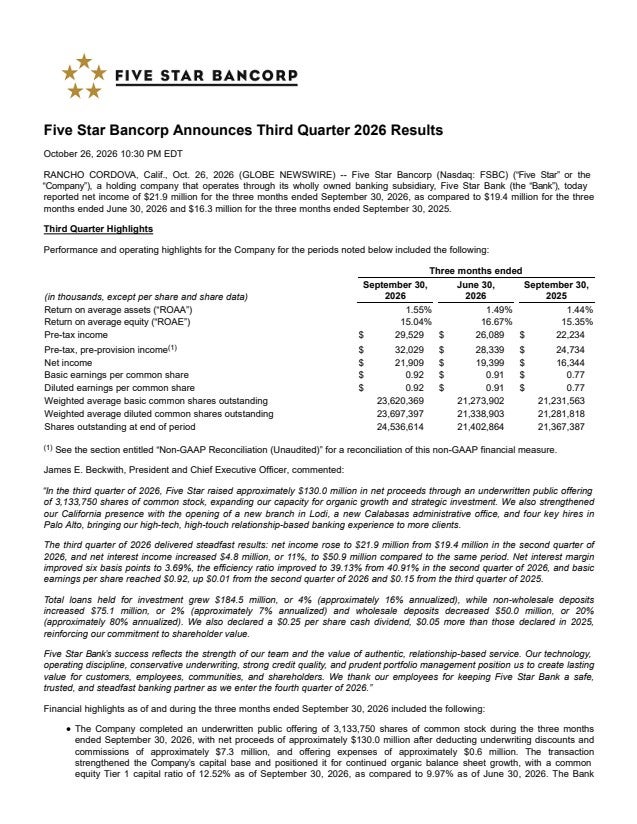
FSBC Q3 2026 EPS Results
- Actual EPS
- $0.92
- Consensus EPS
- $0.85
- Beat/Miss
- Beat by +$0.07
- One Year Ago EPS
- $0.77
FSBC Q3 2026 Revenue Results
- Actual Revenue
- $80.87M
- Expected Revenue
- $51.31M
- Beat/Miss
- Beat by +$29.56M
- YoY Revenue Growth
- +21.04%
Earnings Announcement Details
- Quarter
- Q3 2026
- Date
- 10/26/2026
- Time
- After Close
- Conference Call
- Monday, October 26, 2026
Five Star's next earnings date is estimated for February 1, 2027, based on past reporting schedules.
Q3 2026 Earnings Call Audio
Q3 2026 Earnings Slide Deck
Q3 2026 Earnings Call Summary
The call was strongly positive overall. Management reported higher net income, pretax pre-provision income, net interest income, net interest margin, loans, liquidity and capital, along with improved efficiency and stable credit quality. The company also continued expanding across California and maintained positive loan growth guidance. Offsetting factors included lower return on average equity, modest share dilution, higher deposit funding costs, lower noninterest income, increased expenses, competitive pricing pressure, a slowdown in acquisition financing and continued economic and rate uncertainty.
Management said it was “pretty comfortable with the margin from 3.65% to 3.75%,” expects funding costs to go up “in the next few quarters,” and is “guiding 10% to 12% in Q4 and probably 10% to 12% for 2027” for loan growth; new relationships with noninterest-bearing transactional balances and liquidity balances may be priced “with a 2 handle, blended, maybe high 2s,” while loan repricing is expected to support yields “probably for the next 3 or 4 quarters,” including about $135 million of 5-year loans repricing in the current quarter from a weighted average rate of 4.27% and about $694 million repricing next year from a weighted average rate of 5%, with manufactured home loans repricing to 6.75% to 7.25%; for expenses, management said adding about $200,000 for Q4 2026 would likely be appropriate and expects expenses to remain between 1.45% to 1.50% of average assets.
- Net Income and Profitability GrowthQ3 2026 net income increased to $21.9 million from $19.4 million in Q2 2026, up 13% quarter-over-quarter. Pretax pre-provision income rose to $32 million from $28.3 million, also up 13%.
- Earnings Per Share Increased Despite Equity IssuanceBasic earnings per share rose to $0.92 despite an 11% increase in weighted average basic common shares outstanding following the July underwritten public offering.
- Balance Sheet and Loan GrowthLoans held for investment grew by $184.5 million during the quarter, or approximately 16% annualized, reaching $4.7 billion at September 30, 2026. Total assets increased by $182 million during the quarter, driven primarily by strong loan growth, including an $81.8 million increase in commercial real estate loans and a $50.9 million increase in consumer loans. Year-over-year total assets grew from $4.6 billion to $5.6 billion.
- Net Interest Income and Margin ExpansionNet interest income increased to $50.9 million, up 10.51% from $46.1 million in the prior quarter. Net interest margin improved by 6 basis points quarter-over-quarter to 3.69%, primarily reflecting growth in higher-yielding loans and an increase in the yield on interest-earning assets, partially offset by higher deposit funding costs.
- Strong Interest-Earning Asset GrowthAverage interest-earning assets increased 7%, including a 7% increase in the average balance of loans and a 14% increase in the average balance of interest-earning deposits in banks. The average yield on interest-earning assets increased 5 basis points to 5.74%, while average loan yield increased 6 basis points to 6.14%.
- Positive Loan Repricing OutlookManagement said the margin ended September on a strong note, with an estimated 6 to 7 basis point increase during the month. Approximately $135 million of 5-year loans, carrying a weighted average rate of 4.27%, are expected to reprice in the current quarter. Approximately $694 million of loans with a weighted average rate of 5% are expected to reprice next year. Manufactured community loans booked in 2021 are expected to reprice from average yields in the low 4s to approximately 6.75% to 7.25%.
- Healthy Loan Pipeline and Growth GuidanceManagement described the loan pipeline as very strong and said it was comfortable with the outlook for Q4. Loan growth guidance was 10% to 12% in Q4 and probably 10% to 12% for 2027.
- Improved Deposit MixTotal deposits grew by $25.1 million, while non-wholesale deposits increased by $75.1 million, more than offsetting a planned $50 million reduction in wholesale deposits. Non-wholesale deposits represented approximately 96% of total deposits at quarter end, and noninterest-bearing deposits represented approximately 25.1% of total deposits.
- Stable and Long-Tenured Deposit FranchiseApproximately 62% of deposit relationships exceed $5 million, with an average tenure of approximately 7 years. Management said the long-tenured client base supports the stability and durability of the deposit franchise.
- Strong Liquidity PositionAvailable liquidity was approximately $2.5 billion at September 30, 2026, compared with $2.3 billion at June 30, 2026. Cash and cash equivalents stood at $679.5 million, representing 14.08% of total deposits.
- Capital Strengthened Through Public OfferingThe underwritten public offering generated approximately $130 million of net proceeds. Common equity Tier 1 capital increased to 12.52%, up 255 basis points from the prior quarter; the Tier 1 leverage ratio increased to 11.21%; and the total risk-based capital ratio increased to 15%. Total shareholders' equity reached approximately $617 million, and the bank continued to exceed all regulatory standards required to be considered well capitalized.
- Strong Credit Quality and Conservative UnderwritingNonperforming loans declined to 0.28% of total loans from 0.30% in the prior quarter. Management said the nonperforming loan balance primarily related to a single $11.4 million Community Reinvestment Act-related credit that remains well secured by collateral with an appraised value that meaningfully exceeds its carrying amount. Commercial real estate loans had a weighted average loan-to-value of approximately 56%, and credit trends across the remainder of the portfolio remained stable.
- Reserve Coverage MaintainedThe allowance for credit losses totaled $49.4 million, or 1.05% of loans held for investment, at September 30, 2026. Management said reserve levels were appropriate given the portfolio composition, current credit performance and broader economic environment.
- Efficiency Ratio ImprovedThe efficiency ratio improved to 39.13% from 40.91% in Q2 2026 and 40.13% in Q3 2025, reflecting disciplined expense management while the company continued investing in growth.
- California Expansion and Team GrowthThe company opened a full-service branch in Lodi, opened a Calabasas administrative office, added four experienced banking professionals in Palo Alto, and increased its business development officer team from 45 to 50. Management also said it continued to see hiring opportunities, particularly in Southern California.
- Southern California Market ProgressThe Calabasas group was seeing commercial and industrial opportunities, owner-occupied commercial real estate and strong core deposits. Newport Beach was seeing construction and commercial and industrial opportunities. Management said both markets were making very good progress toward a goal of reaching $100 million in deposits in each market.
- Shareholder Returns and Book Value GrowthThe company paid a cash dividend of $0.25 per share in Q3 and declared an additional $0.25 per share dividend expected to be paid in November 2026. Book value per share increased 14% from the prior quarter to $25.15.
- Floating-Rate Exposure and Strategic PositioningApproximately 73% of loans held for investment are adjustable or floating rate. Management said strong liquidity, conservative underwriting, capital strength and the floating-rate portfolio positioned the balance sheet to perform across a range of economic conditions.
FSBC Earnings History
| Report Date | Fiscal Quarter | Forecast / EPS | Last Year's EPS | EPS YoY Change | Press Release |
|---|---|---|---|---|---|
| Feb 01, 2027 | 2026 (Q4) | 0.86- | 0.83 | ― | ― |
| Oct 26, 2026 | 2026 (Q3) | 0.850.92 | 0.77 | 19.48% (+0.15) | |
| Jul 22, 2026 | 2026 (Q2) | 0.860.91 | 0.68 | 33.82% (+0.23) | |
| Apr 27, 2026 | 2026 (Q1) | 0.790.87 | 0.62 | 40.32% (+0.25) | |
| Jan 26, 2026 | 2025 (Q4) | 0.760.83 | 0.63 | 31.75% (+0.20) | |
| Oct 27, 2025 | 2025 (Q3) | 0.710.77 | 0.52 | 48.08% (+0.25) | |
| Jul 23, 2025 | 2025 (Q2) | 0.640.68 | 0.51 | 33.33% (+0.17) | |
| Apr 28, 2025 | 2025 (Q1) | 0.590.62 | 0.62 | 0.00% (+0.00) | |
| Jan 27, 2025 | 2024 (Q4) | 0.570.63 | 0.63 | 0.00% (+0.00) | |
| Oct 28, 2024 | 2024 (Q3) | 0.530.52 | 0.64 | -18.75% (-0.12) |
The table shows recent earnings report dates and whether the forecast was beat or missed. See the change in forecast and EPS from the previous year.
