


FRMO earnings date
Want to see FRMO full AI Analyst Report?
FRMO (FRMO) Q3 2026 Earnings Report
FRMO Q3 2026 EPS Results
- Actual EPS
- $1.89
- Consensus EPS
- ―
- Beat/Miss
- ―
- One Year Ago EPS
- -$0.65
FRMO Q3 2026 Revenue Results
- Actual Revenue
- $2.12M
- Expected Revenue
- ―
- Beat/Miss
- ―
- YoY Revenue Growth
- -38.95%
Earnings Announcement Details
- Quarter
- Q3 2026
- Date
- 02/28/2026
- Time
- After Close
- Conference Call
- Saturday, February 28, 2026
FRMO's next earnings date is estimated for January 14, 2027, based on past reporting schedules.
Q3 2026 Earnings Call Audio
No earnings call audio is available for this earnings event.
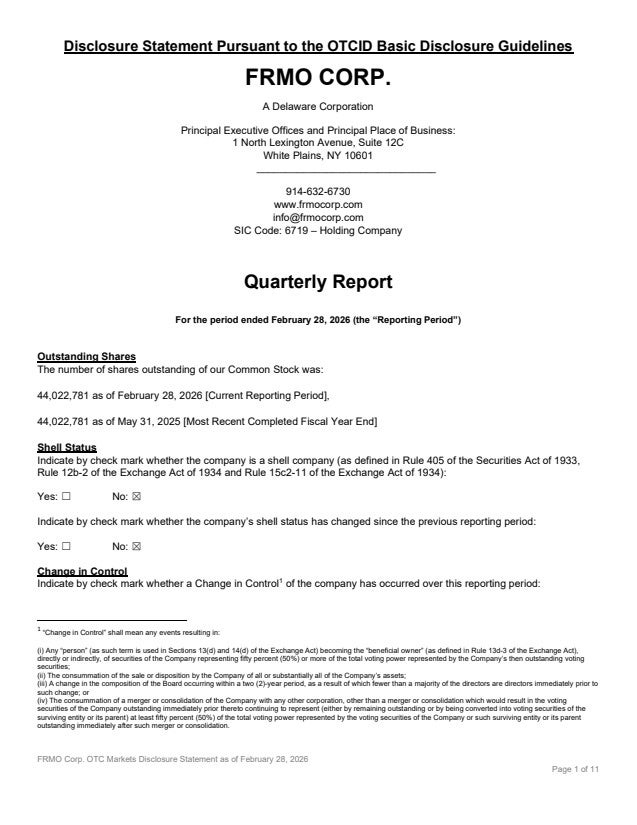
Q3 2026 Earnings Slide Deck
Q3 2026 Earnings Call Summary
The call emphasized strong underlying fundamentals: sizable unrealized gains driven by strategic equity holdings (notably TPL, Horizon Kinetics and MIAX), a debt-free balance sheet with >$45M cash, profitable short-sale operations, and a long-term compounding track record. These positives were tempered by meaningful cryptocurrency losses (Bitcoin down 26% in Q3 and 36% YTD), reduced advisory fee revenue, and a tax expense that depressed reported net income. Management also addressed a corrected reporting omission regarding founder ownership and outlined plans to increase operational stakes (Winland) and pursue board engagement with strategic investments. Overall, the company presents financial strength and strategic momentum, while acknowledging near-term headwinds from crypto exposure and fee timing.
Management's guidance stressed balance-sheet strength and a steady, deliberate path forward: FRMO reported Q3 net income attributable to the company of $83.0M and year‑to‑date net income of just shy of $57.0M, holds over $45.0M in cash, and is debt‑free as of February; key investments drove unrealized gains (TPL +82% in Q3, +40% YTD; Horizon Kinetics Holding +20%+ in Q3; MIAX down slightly in Q3 but ~+80% since prior year‑end) while crypto exposures weighed on results (Bitcoin -26% in Q3, -36% YTD). They noted conservative risk management (short positions with securities sold not yet purchased of $717K vs $1.3M on 5/31/25 and cumulative short proceeds just over $9M), continued focus on strategic assets (FRMO book value grew from $115M/$1.61 per share on 5/31/20 to $353M/$8.02 per share on 5/31/25), plans to increase Winland ownership (now ~47% with a >50% target by year‑end), exploration of board engagement with TPL/MIAX, and ongoing investments in research and selective crypto‑mining opportunities rather than any rapid or forced transactions.
- Strong Quarterly Net IncomeFRMO reported net income attributable to FRMO of $83 million for the quarter (FY2026 Q3), with year-to-date net income reported as just shy of $57 million (as stated on the call).
- Large Unrealized Gains Driven by Strategic HoldingsTPL (largest holding) increased 82% during Q3 and ~40% year-to-date; Horizon Kinetics Holding Corporation rose over 20% during Q3; MIAX was a strong year-to-date contributor, up ~80% from prior year-end despite a slight Q3 dip.
- Balance Sheet Strength and LiquidityFRMO has over $45 million of cash on the balance sheet and reported being debt-free as of February after sale of land/building, underpinning a 'fortress' balance sheet and operational flexibility.
- Profitable Short Strategy ContributionPersistent short sales of path-dependent ETFs produced cumulative short-sale proceeds of over $9 million (less than $10M); the difference between market value and short-sale proceeds represents nearly $9 million of realized/unrealized profit and equals roughly ~2.5% of the total market value of the balance sheet.
- Demonstrated Long-Term Compounding Track RecordFRMO highlighted long-term book-value growth: from $0.01 per share (circa 2000) to $1.61 by May 31, 2020 (~19% annual compounded) and to $8.02 by May 31, 2025 (~20.5% annual compounded), illustrating multi-decade compounding performance.
- Strategic Positioning and M&A Intent (Winland & MIAX)Management reiterated intent to increase FRMO's stake in Winland (currently ~47%) to exceed 50% (targeted by year-end) and noted active engagement with MIAX/MIH leadership with the potential for board engagement, reflecting focus on converting strategic stakes into operational value.
- Consolidation and Reporting of Hard AssetsFRMO consolidates Horizon Kinetics Hard Assets (FRMO owns just shy of 22%), and consolidated results are now footnoted (footnote 12), improving transparency around that business segment.
- Active Deal/Research Pipeline and Talent DevelopmentManagement emphasized ongoing idea flow from analysts and strategic engagements across exchanges, energy and infrastructure; internal examples include promotion/mobilization of talent (e.g., analysts moving into product/ETF and crypto mining operations) and investment in research capacity.
FRMO Earnings History
| Report Date | Fiscal Quarter | Forecast / EPS | Last Year's EPS | EPS YoY Change | Press Release |
|---|---|---|---|---|---|
| Jan 14, 2027 | 2027 (Q2) | ―- | -0.3 | ― | ― |
| Nov 12, 2026 | 2027 (Q1) | ―-0.81 | -0.3 | -166.23% (-0.51) | |
| Aug 28, 2026 | 2026 (Q4) | ―-1.23 | -1.15 | -6.70% (-0.08) | |
| Feb 28, 2026 | 2026 (Q3) | ―1.89 | -0.65 | 390.34% (+2.54) | |
| Feb 27, 2026 | 2026 (Q2) | ―-0.30 | 3.11 | -109.52% (-3.41) | |
| Oct 15, 2025 | 2026 (Q1) | ―-0.30 | 0.78 | -138.95% (-1.09) | |
| Aug 14, 2025 | 2025 (Q4) | ―-1.15 | 0.51 | -324.41% (-1.66) | |
| Apr 15, 2025 | 2025 (Q3) | ―-0.65 | 0.29 | -321.02% (-0.95) | |
| Jan 15, 2025 | 2025 (Q2) | ―3.11 | 0.11 | 2806.54% (+3.00) | |
| Oct 16, 2024 | 2025 (Q1) | ―0.78 | 0.73 | 6.68% (+0.05) |
The table shows recent earnings report dates and whether the forecast was beat or missed. See the change in forecast and EPS from the previous year.
