


Terna S.p.A. stock analysis
Terna S.p.A. (UEI) Stock Price & Analysis
UEI Stock Chart & Stats
- Day’s Range
- EUR 9.81 - EUR 9.84
- 52-Week Range
- EUR 8.68 - EUR 10.41
- Previous Close
- EUR 9.71
- Volume
- N/A
- Average Volume (3M)
- 424
- Market Cap
- EUR 19.57B
- Enterprise Value
- EUR 35.70B
- Total Cash (Recent Filing)
- EUR 2.27B
- Total Debt (Recent Filing)
- EUR 14.86B
- Price to Earnings (P/E)
- 18.0
- Beta
- 0.14
- Next Earnings
- Mar 24, 2027 (Est.)
- EPS Estimate
- 0.13
- Next Dividend Ex-Date
- N/A
- Dividend Yield
- 3.97%
Bulls Say, Bears Say
Bulls Say
Regulated Transmission Model
The regulated TSO model provides a durable revenue foundation, with allowed returns and cost-recovery mechanisms tied to the transmission asset base. Continued grid development can expand the regulated asset base and support recurring earnings visibility.
Strong Revenue And Profitability
Meaningful revenue acceleration alongside consistently high operating and net margins indicates strong underlying earnings capacity. This profitability supports investment funding and provides resilience as Terna expands and modernizes critical grid infrastructure.
Improving Leverage And Operating Cash Flow
The reduction in debt-to-equity and stronger 2025 operating cash flow improve financial sustainability and funding flexibility. Although investment remains substantial, better internal cash generation and a larger equity base support long-term grid expansion.
Bears Say
Persistently Negative Free Cash Flow
Repeatedly negative free cash flow means substantial capital investment and working-capital requirements continue to absorb cash despite positive earnings. This can increase reliance on external financing and constrain flexibility if funding conditions or project costs worsen.
High Absolute Debt Burden
The large debt balance remains a structural vulnerability for a capital-intensive network operator. Higher financing obligations can limit room for additional investment or shareholder distributions, particularly if rates rise or regulated returns do not keep pace.
Margin Compression And Volatility
Although profitability remains strong, the lower net margin and volatile gross margin suggest that cost, revenue mix, or operating conditions can affect earnings quality. Sustained compression would reduce the cash available to fund Terna’s extensive investment program.
Terna S.p.A. News








UEI FAQ
What was Terna S.p.A.’s price range in the past 12 months?
What is Terna S.p.A.’s market cap?
When is Terna S.p.A.’s upcoming earnings report date?
How were Terna S.p.A.’s earnings last quarter?
Is Terna S.p.A. overvalued?
Does Terna S.p.A. pay dividends?
What is Terna S.p.A.’s EPS estimate?
How many shares outstanding does Terna S.p.A. have?
What happened to Terna S.p.A.’s price movement after its last earnings report?
Which hedge fund is a major shareholder of Terna S.p.A.?
What is the TipRanks Smart Score and how is it calculated?
Company Description
Terna S.p.A.
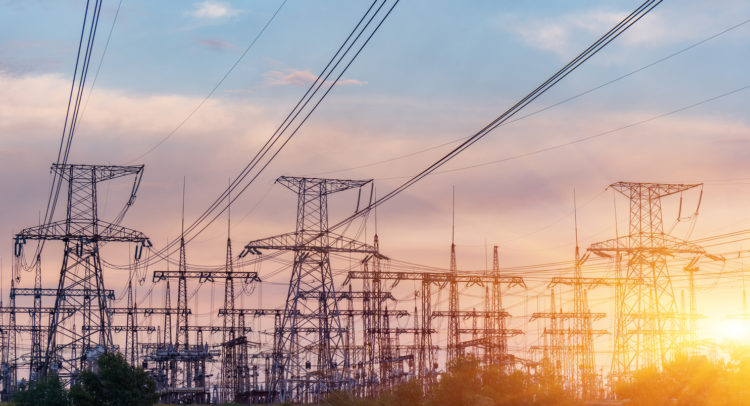
Terna - Rete Elettrica Nazionale Società per Azioni, along with its subordinate entities, is engaged in the crucial activities of electricity transmission and dispatching, with operations spanning Italy, other Euro-area nations, and international markets. The company structures its business into three primary segments: Regulated, Non-Regulated, and International. At its core, Terna is responsible for the entire lifecycle of Italy's national transmission grid and associated high-voltage electrical infrastructure. This encompasses everything from strategic planning and development to day-to-day management, operational oversight, and ongoing maintenance. Significantly, Terna also holds ownership of this national grid. Beyond its core utility functions, the company offers a suite of related services, including telecommunications infrastructure and solutions, connectivity services, specialized energy solutions, and comprehensive operation and maintenance support. Terna further diversifies its portfolio through manufacturing, designing, producing, and marketing various transformers—such as those for electricity transmission and distribution networks, industrial applications (like steel and metals), and specialized units for electrochemical conversion. Additionally, the firm is involved in the design, production, and supply of both marine and terrestrial cables. In terms of project development, Terna actively pursues and implements initiatives in renewable energy, alongside undertaking private interconnector projects. The company was founded in 1999 and maintains its corporate headquarters in Rome, Italy.
- Sector
- General
- Industry
- Regulated Electric
- CEO
- Pasqualino Monti
- Employees
- 7,260
- Website
- www.terna.it
- Address
- Viale Egidio Galbani 70, Rome, RM, 00156, IT
Terna S.p.A. (UEI) Earnings & Revenues
UEI Stock 12 Month Forecast
Average Price Target
Technical Analysis
Overall Consensus
| Indicator | Bullish | Neutral | Bearish |
|---|---|---|---|
| Overall Consensus | 13 | 4 | 5 |
| Technical Analysis | 3 | 4 | 3 |
| Moving Averages | 10 | 0 | 2 |
