

Anheuser-Busch Inbev Sa (ITKA) Q3 2026 Earnings Report
DE:ITKA Q3 2026 EPS Results
- Actual EPS
- EUR 1.08
- Consensus EPS
- EUR 1.02
- Beat/Miss
- Beat by +EUR 0.06
- One Year Ago EPS
- EUR 0.89
DE:ITKA Q3 2026 Revenue Results
- Actual Revenue
- ―
- Expected Revenue
- EUR 14.57B
- Beat/Miss
- ―
- YoY Revenue Growth
- ―
Earnings Announcement Details
- Quarter
- Q3 2026
- Date
- 10/29/2026
- Time
- Before Open
- Conference Call
- Thursday, October 29, 2026
Anheuser-Busch Inbev Sa's next earnings date is estimated for March 4, 2027, based on past reporting schedules.
Q3 2026 Earnings Call Audio
Q3 2026 Earnings Slide Deck
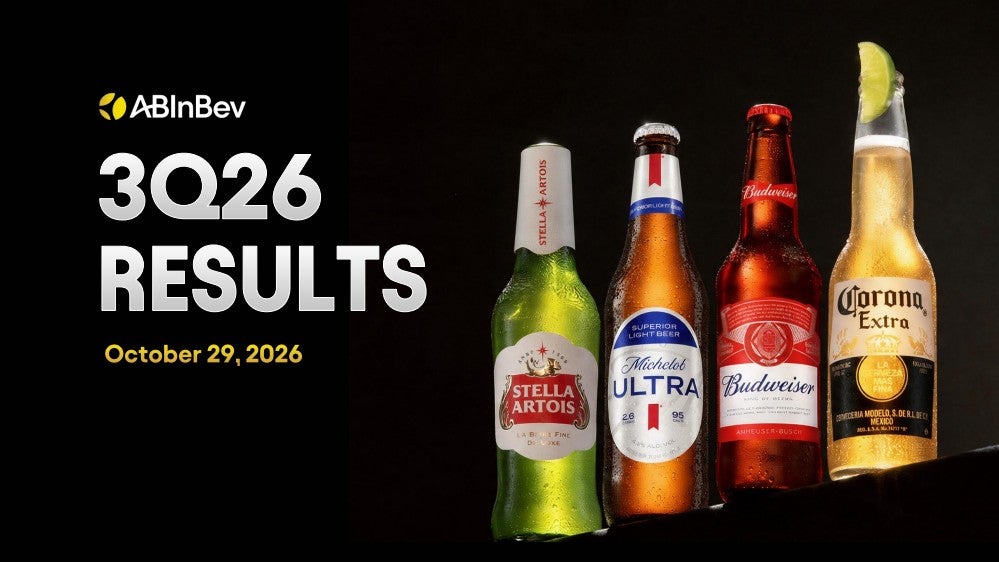
Q3 2026 Earnings Call Summary
The call was strongly positive overall. The company delivered broad-based revenue, volume, market share, EBITDA, EBIT, and EPS growth; reported strong momentum in key brands, non-alcohol beer, Beyond Beer, digital platforms, and Middle Americas; and increased shareholder returns through a higher dividend and ongoing buybacks. The main challenges were the sharp decline in China, flattish consolidated margins, U.S. cost pressures, and uncertainty around Brazil's consumer and tax environment, but management expressed confidence in the 2026 outlook and continued operational momentum.
Management said it is not providing any guidance so far for 2027; its midterm outlook is evolving from EBITDA 4% to 8% to become EBIT 5% to 9%. Management remains confident in its ability to deliver its 2026 outlook, expects EBITDA growth to remain more or less balanced between first half and second half, and said next year is looking like more of a normal year, or another normal year, with no outlook for next year yet and disclosure planned during full year earnings in February. Pricing is expected to remain in line with CPI on average, while 25% to one third of revenue per hectoliter is a contribution from mix and around 70% is pure price rate; in China, the objective is to get to the end of this year with normal inventories.
- Solid Third-Quarter Revenue and Earnings GrowthRevenue increased by 4.9%, revenue per hectoliter increased by 4.2%, EBITDA increased by 3.9%, EBIT increased by 6%, and underlying EPS increased by 22% to reach $1.21. Constant-currency EPS growth was 13.9%, while dollar EPS increased by 22.4%, supported by top-line growth, cost management, and continued business optimization.
- Continued Volume and Market Share MomentumVolumes grew for a third consecutive quarter, with total volumes up 0.4% in the third quarter. The company reported global market share growth and record-high third-quarter volumes in 15 markets, including Colombia, Peru, Ecuador, South Africa, India, and the Dominican Republic.
- Revenue Management and Mix Supported GrowthRevenue per hectoliter increased by 4.2% in the quarter and 4.3% year to date. The company said approximately 25% to one third of revenue-per-hectoliter growth came from mix, including premiumization, RTD, non-alcohol beer, and brands, while around 70% came from pure price rate.
- Investment in Brands and Growth PlatformsThe company stepped up sales and marketing investments to activate key mega platforms, strengthen brand power, and increase participation across its portfolio. It invested $8.1 billion in sales and marketing over the last 12 months to support its growth priorities.
- Strong Mega-Brand PerformanceMega-brand net revenue increased by 7.7% during the quarter. Corona revenue grew by 20% outside Mexico, while Corona volumes grew by double digits in 37 markets.
- Non-Alcohol Beer OutperformedThe non-alcohol beer portfolio outperformed the industry and delivered a 35% revenue increase, led by Corona Zero and Michelob ULTRA Zero. The company estimated that 60% of volume came from new occasions and new consumers. Non-alcohol beer represented more than 1.5% of the business and was approaching 2% on a run-rate basis, with double-digit growth in most markets.
- U.S. Share Gains and Beyond Beer GrowthThe company gained share of total alcohol in the U.S. for 10 consecutive quarters and was the number one share gainer year to date. Michelob ULTRA and Busch Light were the top two volume share gainers in the industry, while the U.S. Beyond Beer portfolio delivered revenue growth in the low teens, led by Cutwater and NÜTRL.
- Middle Americas Delivered Broad-Based GrowthIn Mexico, market share gains and margin expansion drove mid-single digit volume growth and double-digit bottom-line growth. Colombia delivered record-high third-quarter volumes and double-digit top- and bottom-line growth, with volume and revenue growth across all price segments. In Brazil, market share momentum and volume growth drove a mid-single digit top- and bottom-line increase, while the premium and super-premium beer portfolio delivered high teens volume growth.
- Europe and South Africa PerformanceIn Europe, market share gains and premiumization supported continued top-line growth, with volumes flat and the company estimating that it gained or maintained share in a majority of key markets. In South Africa, record-high volumes and premiumization drove high single-digit top-line growth, while the premium beer portfolio delivered mid-thirds volume growth.
- Michelob ULTRA Global ExpansionMichelob ULTRA continued expanding outside the U.S.; 60% of the brand's global growth in the third quarter came from outside the U.S., compared with 40% during the World Cup. The company reported strong momentum in Brazil, Argentina, Colombia, and Mexico and described the brand as either core plus or premium outside the U.S.
- BEES Marketplace Continued to ScaleBEES captured $15.9 billion in gross merchandising value in the third quarter, a 12% increase versus last year. Gross merchandising value from third-party products increased by 45% versus last year to reach $1.4 billion.
- Digital Direct-to-Consumer GrowthThe company's digital platforms served 13 million consumers and generated $158 million in revenue. Its direct-to-consumer marketplace for third-party products reached annualized gross merchandising value of $200 million.
- Strong Balance Sheet and Capital AllocationLast-twelve-month free cash flow was greater than any annual bond maturity, leaving the company with no relevant refinancing needs. 98% of debt was fixed rate with an average coupon of around 4%, and the company stated that its bonds had no financial covenants.
- Higher Dividend and Share RepurchasesThe board approved an interim dividend of EUR 0.40 per share, compared with EUR 0.15 per share last year. The company continued its 24-month, $6 billion share buyback program and had repurchased $2.6 billion of shares to date.
- Confidence in 2026 Outlook and Future Margin OpportunityManagement said that year-to-date results, execution, and the company's ownership culture reinforced confidence in delivering its 2026 outlook. Management also said it was confident there were opportunities for further margin expansion over time, while the company's midterm outlook had evolved from EBITDA growth of 4% to 8% to EBIT growth of 5% to 9%.
- BeatBox Integration ProgressBeatBox's first year of integration was described as progressing well with no surprises. Management identified opportunities in distribution, household penetration, innovation, pack, and price, with full integration into commercial plans expected next year.
DE:ITKA Earnings History
| Report Date | Fiscal Quarter | Forecast / EPS | Last Year's EPS | EPS YoY Change | Press Release |
|---|---|---|---|---|---|
| Mar 04, 2027 | 2026 (Q4) | 0.99- | 0.85 | ― | ― |
| Oct 29, 2026 | 2026 (Q3) | 1.021.08 | 0.89 | 22.22% (+0.20) | |
| Jul 30, 2026 | 2026 (Q2) | 1.001.08 | 0.88 | 23.47% (+0.21) | |
| May 05, 2026 | 2026 (Q1) | 0.790.87 | 0.73 | 19.75% (+0.14) | |
| Feb 12, 2026 | 2025 (Q4) | 0.790.85 | 0.79 | 7.95% (+0.06) | |
| Oct 30, 2025 | 2025 (Q3) | 0.860.89 | 0.88 | 1.02% (+0.01) | |
| Jul 31, 2025 | 2025 (Q2) | 0.860.88 | 0.81 | 8.89% (+0.07) | |
| May 08, 2025 | 2025 (Q1) | 0.660.73 | 0.67 | 8.00% (+0.05) | |
| Feb 26, 2025 | 2024 (Q4) | 0.620.79 | 0.73 | 7.32% (+0.05) | |
| Oct 31, 2024 | 2024 (Q3) | 0.830.88 | 0.77 | 13.95% (+0.11) |
The table shows recent earnings report dates and whether the forecast was beat or missed. See the change in forecast and EPS from the previous year.
