

JD Sports Fashion (9JD) Stock Price & Analysis
9JD Stock Chart & Stats
- Day’s Range
- EUR 1.11 - EUR 1.11
- 52-Week Range
- EUR 0.75 - EUR 1.11
- Previous Close
- EUR 1.09
- Volume
- N/A
- Average Volume (3M)
- 117
- Market Cap
- EUR 5.19B
- Enterprise Value
- EUR 7.76B
- Total Cash (Recent Filing)
- EUR 703.00M
- Total Debt (Recent Filing)
- EUR 3.64B
- Price to Earnings (P/E)
- 8.0
- Beta
- 1.13
- Next Earnings
- Jul 13, 2027 (Est.)
- EPS Estimate
- 0.08
- Next Dividend Ex-Date
- N/A
- Dividend Yield
- 1.34%
Bulls Say, Bears Say
Bulls Say
Revenue Scale And Growth
The expansion of revenue over several years indicates that JD has materially increased its commercial scale and customer reach. A larger platform can support stronger buying terms, broader brand relationships, and operating leverage, providing a durable foundation for future growth.
Exclusive Assortment
A substantial exclusive assortment differentiates JD from general sportswear retailers and can make its stores and websites more compelling destinations. Exclusive products may support customer loyalty, improve merchandising control, and reduce direct comparability while strengthening brand relationships.
Capital-Light International Expansion
The Mexico agreement and broader franchise pipeline extend JD’s international reach without requiring the group to fund every store directly. This capital-light model can widen the brand footprint, diversify geographic earnings, and create growth opportunities with lower direct investment needs.
Bears Say
Elevated Leverage
Debt remains high relative to equity, leaving JD more sensitive to profit volatility and cash-flow pressure than a lightly leveraged retailer. Although equity has grown, elevated obligations can constrain financial flexibility and reduce the capacity to absorb weaker trading or fund expansion internally.
Margin And Promotional Pressure
Persistent promotional conditions and price investment are pressuring gross margins and operating profit even while the business retains substantial scale. If this environment continues, weaker conversion of sales into earnings could limit reinvestment capacity and make profitability more dependent on cost savings.
North America Weakness
North America is an important operating region but is currently experiencing weaker demand, softer high-heat footwear trading, and cost pressures. The combination of declining comparable sales and margin contraction can weigh disproportionately on group earnings while the Finish Line transition continues.
JD Sports Fashion News






9JD FAQ
What was JD Sports Fashion’s price range in the past 12 months?
What is JD Sports Fashion’s market cap?
When is JD Sports Fashion’s upcoming earnings report date?
How were JD Sports Fashion’s earnings last quarter?
Is JD Sports Fashion overvalued?
Does JD Sports Fashion pay dividends?
What is JD Sports Fashion’s EPS estimate?
How many shares outstanding does JD Sports Fashion have?
What happened to JD Sports Fashion’s price movement after its last earnings report?
Which hedge fund is a major shareholder of JD Sports Fashion?
What is the TipRanks Smart Score and how is it calculated?
JD Sports Fashion Stock Smart Score
Company Description
JD Sports Fashion
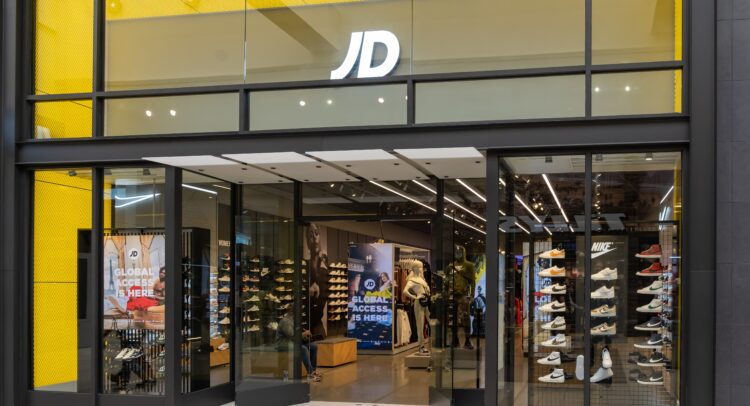
JD Sports Fashion plc stands as a leading global retailer, specializing in athletic and outdoor apparel, footwear, and accessories. The company serves a diverse customer base of men, women, and children through its dedicated Sports Fashion and Outdoor divisions. Beyond its primary offerings, JD Sports also sells a broad spectrum of leisure and sports merchandise, encompassing fishing gear, watches, jewelry, camping supplies, boats, and bicycles, alongside distributing various sports and fashion items. The group manages an extensive portfolio of prominent brands, including its flagship JD, as well as others like Size?, Footpatrol, Finish Line, and Go Outdoors. In addition to its significant physical presence across 3,402 stores, the company maintains a strong online retail operation. Further diversifying its activities, JD Sports is involved in licensing fashion brands, operating fitness centers, managing an online women's fashion brand under its own label, and both manufacturing and distributing professional fitness equipment. Founded in 1981 and headquartered in Bury, UK, this global enterprise conducts business across numerous international markets, including the United Kingdom, a wide array of European countries, North America, Asia, Australia, and the Middle East. JD Sports Fashion plc is a subsidiary of Pentland Group Limited.
- Sector
- Consumercyclical
- Industry
- Apparel - Retail
- CEO
- Régis Andre Schultz
- Employees
- 96,084
- Website
- www.jdplc.com
- Address
- Hollinsbrook Way, Bury, LAN, BL9 8RR, GB
JD Sports Fashion (9JD) Earnings & Revenues
9JD Earnings Call
Earnings Call SentimentPositive
The call had a cautiously positive tone. Management reported declines in group sales, footwear, operating profit and margins amid a difficult consumer and promotional environment, particularly in North America. However, the company emphasized resilient trading, strong online and apparel growth, substantial cash generation, improved balance-sheet strength, disciplined cost management, unchanged guidance, strategic progress in stores and e-commerce, and measurable early results from AI and loyalty initiatives.
View all DE:9JD earnings summaries9JD Stock 12 Month Forecast
Average Price Target
Technical Analysis
Overall Consensus
| Indicator | Bullish | Neutral | Bearish |
|---|---|---|---|
| Overall Consensus | 14 | 5 | 2 |
| Technical Analysis | 2 | 5 | 2 |
| Moving Averages | 12 | 0 | 0 |
