


DREAM Un Cl A earnings date
DREAM Un Cl A (50DA) Q3 2026 Earnings Report
DE:50DA Q3 2026 EPS Results
- Actual EPS
- EUR 0.18
- Consensus EPS
- EUR 0.22
- Beat/Miss
- Missed by -EUR 0.04
- One Year Ago EPS
- EUR 0.41
DE:50DA Q3 2026 Revenue Results
- Actual Revenue
- EUR 70.95M
- Expected Revenue
- EUR 60.37M
- Beat/Miss
- Beat by +EUR 10.58M
- YoY Revenue Growth
- -2.09%
Earnings Announcement Details
- Quarter
- Q3 2026
- Date
- 11/10/2026
- Time
- Before Open
- Conference Call
- Tuesday, November 10, 2026
DREAM Un Cl A's next earnings date is estimated for February 23, 2027, based on past reporting schedules.
Q3 2026 Earnings Call Audio
No earnings call audio is available for this earnings event.
Q3 2026 Earnings Slide Deck
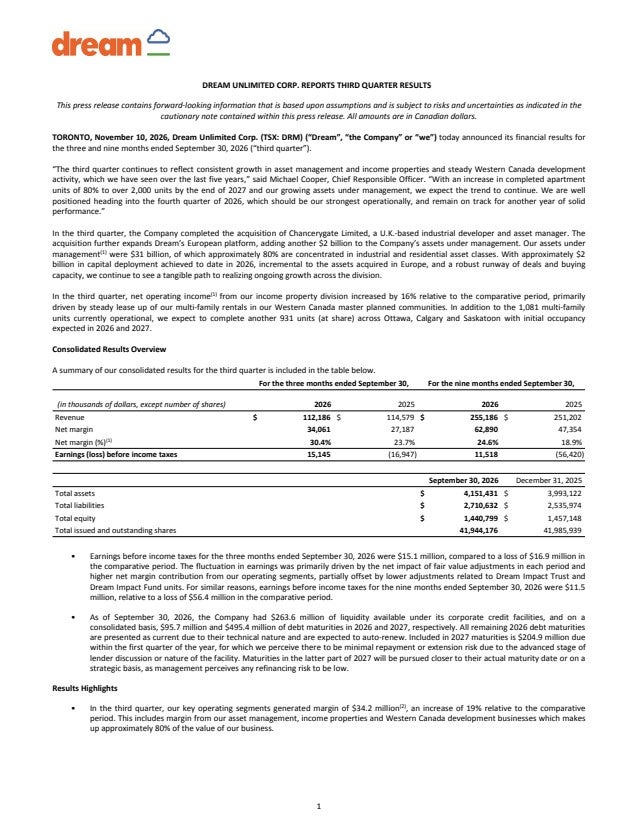
Q3 2026 Earnings Call Summary
The call was strongly constructive overall. Dream reported higher net margin, strong Asset Management performance, $31 billion of AUM, increased income-properties NOI, expanding apartment operations and substantial development and European growth opportunities. The primary challenges were the persistent share-price discount, modestly lower Western Canada development margin, no expected 2026 earnings from Other Investments, Impact Trust’s support and debt requirements, stalled or slow master-plan projects, and unfinished Quayside financing. Management nevertheless expressed confidence in liquidity, debt manageability and the long-term positioning of the business.
Management expects fourth quarter margin to be its strongest of the year, has secured $100 million in Western Canada revenue for the fourth quarter, expects to deliver another 930 units at its share over the course of 2027, and expects no earnings from Other Investments for 2026; Asset Management AUM is currently $31 billion, the business has grown from $10 billion to over $30 billion since 2020, is expected to have over $2 billion of acquisitions for industrial clients, and will likely make about a 10% return on market cap next year, while Asset Management is expected to be the largest division profit-wise this year and probably throughout the budgeting period. Income properties are expected to generate NOI growing at annualized at least 30% per year on average for the next 3 years, or at about a 30% compounded rate over the next 3 years, with about 900 more units coming in the next 5 quarters, less than 5 quarters, let's say, 13 months; management also said it has been buying about 1% or 2% of the company back a year and will continue to buy back stock. In Europe, management said it could knock out a couple of JVs of EUR 200 million or EUR 400 million or U.S. dollars on the low end, while opportunities may exist to grow in a major way on the high end, and it is highly confident of a big Impact Trust update by year-end that will not be a total solution but will be a lot closer to one and provide at least 1.5 years runway.
- Solid Third-Quarter Earnings GrowthStand-alone net margin was $32.6 million, up from $24.1 million in the comparative period, largely driven by growth in Asset Management and income properties. After-tax earnings were $13.1 million, and management expects fourth-quarter margin to be the strongest of the year.
- Asset Management Delivered an Exceptional QuarterAsset Management generated revenue of $23.2 million and net margin of $17.8 million. Net margin increased by $6.8 million year over year, driven by AUM growth and performance fees.
- AUM Reached $31 BillionIncluding acquisitions after quarter-end, assets under management were $31 billion, including mandates acquired through the Chancerygate platform and capital deployed across various mandates during the year.
- Strong Asset Management Expansion PlansManagement expects more than $2 billion of industrial acquisitions on behalf of clients and said momentum is likely to continue. The business has grown from $10 billion to over $30 billion of AUM since 2020 and is expected to be the company’s largest division by profit this year and throughout the budgeting period.
- European Platform Strengthened Through ChancerygateDream closed the Chancerygate acquisition during the quarter, expanding its ability to operate as an asset manager at scale in Europe. The first new European joint venture since the acquisition was nearly documented, with management identifying potential for additional joint ventures of EUR 200 million to EUR 400 million.
- Western Canada Revenue Secured for the Fourth QuarterWestern Canada development generated $8.9 million of net margin in the third quarter. Based on presales commitments achieved to date, the division had secured $100 million of Western Canada revenue for the fourth quarter.
- Income Properties NOI IncreasedIncome properties generated $7.6 million of NOI, up from $6.5 million in the prior year, largely driven by lease-up activity across the apartment portfolio.
- Apartment Portfolio Expansion and Lease-UpApproximately 1,100 multifamily units were operational at period-end, with another 930 units at Dream’s share on track for delivery during 2027 in Saskatoon, Ottawa and Calgary. Management also said completed buildings were approximately 96% leased.
- Expected Income Properties GrowthManagement estimated that income-property NOI could increase at an annualized rate of at least 30% per year on average over the next three years. Western Canada apartment rents were up 20% from completion at BVR I, and the debt on that asset had declined to the 60% to 65% range relative to value.
- Development Pipeline ProgressDream said Homewood preparatory work and servicing for the school site were underway, with the city and Dream working toward full approval in 2027. Management also cited progress at Coopertown, Regina, Alpine Park and other Western Canada developments, with more land moving into development.
- Strong Liquidity and Manageable Near-Term MaturitiesDream had $264 million of liquidity available under corporate credit facilities as of September 30. Approximately $205 million of debt matures in the first quarter of 2027, and management said the remaining 12-month maturities present little refinancing risk based on the nature of the debt, asset class and preliminary lender discussions.
- Improving Other Investments ResultsThe Other Investments segment generated negative net margin of $0.2 million, an improvement from negative net margin of $3.2 million in the comparative period.
- Apartment Financing Includes Attractive Fixed RatesManagement cited takeout debt at 3.89% for Brighton Village Rentals III, approximately 3.2% debt on Block 204 in Ottawa, and roughly 19 years and 2 months remaining on the mortgage for 49 Ontario.
- Positive View of Canadian Federal BudgetManagement characterized the federal budget as constructive and said the mega deduction, major infrastructure investment, housing initiatives, measures addressing homelessness and addiction, and removal of the buyers’ ban for new development could support investment and housing outcomes.
- Favorable Western Canada Land Valuation CommentaryManagement said Alberta land values were probably at an all-time high, citing a bid of $215,000 per acre that was unsuccessful for land carried at approximately $130,000 to $140,000 per acre. Management also said Saskatchewan land transactions had supported values above those reflected in NAV.
DE:50DA Earnings History
| Report Date | Fiscal Quarter | Forecast / EPS | Last Year's EPS | EPS YoY Change | Press Release |
|---|---|---|---|---|---|
| Feb 23, 2027 | 2026 (Q4) | 0.52- | 0.85 | ― | ― |
| Nov 10, 2026 | 2026 (Q3) | 0.220.18 | 0.41 | -55.38% (-0.23) | |
| Aug 11, 2026 | 2026 (Q2) | 0.290.23 | -0.16 | 243.20% (+0.38) | |
| May 13, 2026 | 2026 (Q1) | 0.10-0.19 | -0.22 | 14.57% (+0.03) | |
| Feb 24, 2026 | 2025 (Q4) | 0.160.85 | 1.86 | -54.42% (-1.01) | |
| Nov 12, 2025 | 2025 (Q3) | 0.090.41 | -0.23 | 280.56% (+0.64) | |
| Aug 12, 2025 | 2025 (Q2) | 0.13-0.16 | 0.83 | -118.94% (-0.99) | |
| May 12, 2025 | 2025 (Q1) | -0.01-0.22 | 0.01 | -3600.00% (-0.23) | |
| Feb 26, 2025 | 2024 (Q4) | 1.981.86 | -1.05 | 277.11% (+2.91) | |
| Nov 12, 2024 | 2024 (Q3) | 0.16-0.23 | 0.06 | -500.00% (-0.28) |
The table shows recent earnings report dates and whether the forecast was beat or missed. See the change in forecast and EPS from the previous year.
