

ITT (2II) Q2 2026 Earnings Report
DE:2II Q2 2026 EPS Results
- Actual EPS
- EUR 1.86
- Consensus EPS
- EUR 1.72
- Beat/Miss
- Beat by +EUR 0.15
- One Year Ago EPS
- EUR 1.47
DE:2II Q2 2026 Revenue Results
- Actual Revenue
- EUR 1.32B
- Expected Revenue
- EUR 1.24B
- Beat/Miss
- Beat by +EUR 75.33M
- YoY Revenue Growth
- +51.49%
Earnings Announcement Details
- Quarter
- Q2 2026
- Date
- 08/06/2026
- Time
- Before Open
- Conference Call
- Thursday, August 6, 2026
ITT's next earnings date is estimated for November 4, 2026, based on past reporting schedules.
Q2 2026 Earnings Call Audio
Q2 2026 Earnings Slide Deck
Q2 2026 Earnings Call Summary
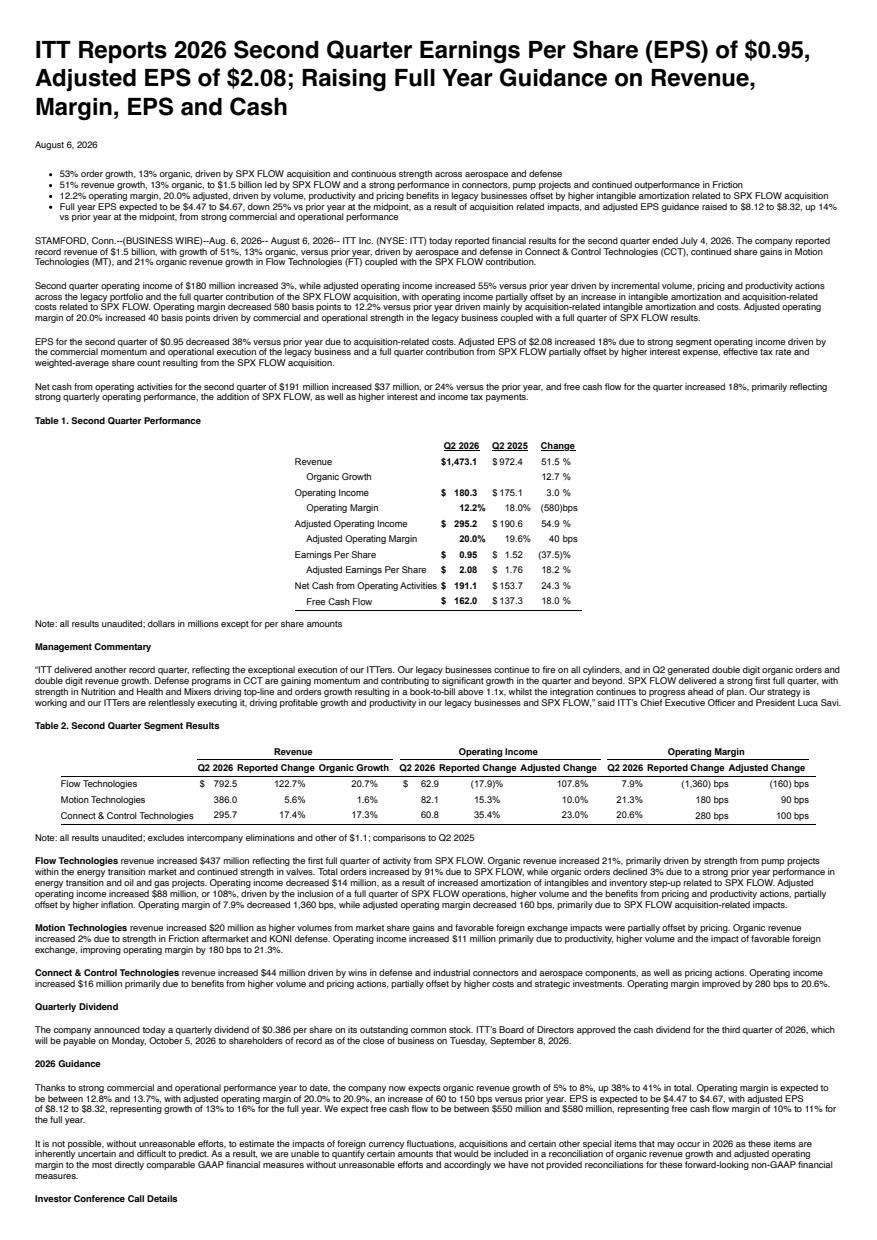
The call presented a strong set of operational and financial results: very large order and revenue growth, margin improvement in key legacy businesses, strong free cash flow generation (adjusted for one-time acquisition costs), faster-than-expected deleveraging, raised guidance, and early signs that acquisitions (SPX FLOW, Svanehøj, kSARIA) are contributing to growth and synergies. Weaknesses were mostly integration work remaining at SPX FLOW, near-term headwinds from Middle East order timing, some dilution to Flow margins from acquisition mix, and one-time acquisition expenses that weighed on reported cash. Overall the positives (substantial organic growth, record revenue, margin expansion, cash/debt progress, and upgraded guidance) materially outweigh the listed lowlights.
ITT raised its 2026 outlook, increasing full‑year organic revenue guidance to 5%–8%, forecasting adjusted operating margin to expand by more than 100 basis points to about 20.5% at the midpoint, and raising adjusted EPS to $8.22 at the midpoint (a $0.37 increase, ~14% growth at the midpoint, with the low end of the new range above the prior high); management also raised the free cash flow midpoint to $565 million (implying a 10%–11% FCF margin) and is targeting ~2.3x leverage by year‑end after a $124 million Q2 paydown that reduced leverage to 2.5x, while maintaining SPX FLOW EPS accretion at $0.10–$0.14 for the year and noting SPX FLOW H1 orders +7% and revenue +9% year‑to‑date (Q2 book‑to‑bill 1.13, YTD B/B 1.05); the revised guidance excludes any tariff refunds beyond the $0.5 million recorded in Q2.
- Strong Top-Line Growth and Book-to-BillOrders increased 53% year-over-year (13% organically) and revenue grew 51% year-over-year (13% organically). Reported Q2 revenue was $1.5 billion and overall book-to-bill for the quarter was ~1.1 (SPX FLOW book-to-bill 1.13).
- Segment Order and Revenue OutperformanceCCT orders grew 59% organically and CCT organic revenue +17% (Commercial Aerospace +14%, Defense +16). kSARIA delivered outsized order growth (reported as +168% in prepared remarks) and revenue up ~28% year-over-year. Connectors orders +38%; Flow Technologies orders +91% (total) with Flow organic revenue +21% (Flow total revenue +123% including acquisitions). Motion Technologies outperformed OE and aftermarket with revenue +6% (2% organic).
- Margin Expansion and EPS GrowthAdjusted EPS of $2.08, up 18% year-over-year. Company expanded adjusted operating margin ~40 basis points in the quarter. CCT margin reached 21.7% (+100 bps YoY, +240 bps sequentially); Motion Technologies margin 21.1% (+90 bps); Flow Technologies (ex-SPX) expanded margins ~70 bps.
- Cash Generation and DeleveragingYear-to-date free cash flow of $176 million (noted as a record quarter); Q2 free cash flow margin ~11%. The company paid down $124 million of debt in Q2, reducing leverage to ~2.5x (six months ahead of target) and is targeting ~2.3x by year-end. Management raised full-year free cash flow midpoint to $565 million (10–11% margin).
- Acquisition Integration & Early SPX FLOW PerformanceSPX FLOW contributed revenue growth (+5% in Q2, +9% year-to-date) and orders (+9% in Q2, book-to-bill >1). Management reports cost synergies from SPX FLOW ahead of plan and maintains EPS accretion expectation of $0.10–$0.14 for the year; the full quarter of SPX FLOW contributed ~$0.68 to EPS bridge.
- Upgraded Full-Year GuidanceRaised full-year organic revenue guidance to 5–8% growth and raised adjusted EPS guidance to a $8.22 midpoint (approx. +14% at midpoint). Adjusted operating margin expected to expand >100 bps to ~20.5% at the midpoint.
- Successful Bolt-on Acquisitions & Backlog ExpansionSvanehøj projected to grow revenue ~32% average annually through end of 2026 with book-to-bill ~1.2 and backlog up ~40% since acquisition; kSARIA backlog and orders projected to meaningfully increase (management cited backlog growth of ~180% since acquisition by end of 2026). Company highlighted record July orders in early Q3 and a funnel up 34% year-over-year.
DE:2II Earnings History
| Report Date | Fiscal Quarter | Forecast / EPS | Last Year's EPS | EPS YoY Change | Press Release |
|---|---|---|---|---|---|
| Nov 04, 2026 | 2026 (Q3) | 1.86- | 1.59 | ― | ― |
| Aug 06, 2026 | 2026 (Q2) | 1.721.86 | 1.47 | 26.83% (+0.39) | |
| May 06, 2026 | 2026 (Q1) | 1.541.77 | 1.3 | 36.55% (+0.47) | |
| Feb 05, 2026 | 2025 (Q4) | 1.591.66 | 1.34 | 23.33% (+0.31) | |
| Oct 29, 2025 | 2025 (Q3) | 1.491.59 | 1.31 | 21.92% (+0.29) | |
| Jul 31, 2025 | 2025 (Q2) | 1.441.47 | 1.33 | 10.07% (+0.13) | |
| May 01, 2025 | 2025 (Q1) | 1.291.30 | 1.27 | 2.11% (+0.03) | |
| Feb 06, 2025 | 2024 (Q4) | 1.321.34 | 1.2 | 11.94% (+0.14) | |
| Oct 29, 2024 | 2024 (Q3) | 1.281.31 | 1.23 | 6.57% (+0.08) | |
| Aug 01, 2024 | 2024 (Q2) | 1.301.33 | 1.19 | 12.03% (+0.14) |
The table shows recent earnings report dates and whether the forecast was beat or missed. See the change in forecast and EPS from the previous year.
