


Chartwell Retirement Residences earnings date
Chartwell Retirement Residences (CWSRF) Q3 2026 Earnings Report
CWSRF Q3 2026 EPS Results
- Actual EPS
- $0.25
- Consensus EPS
- ―
- Beat/Miss
- ―
- One Year Ago EPS
- -$0.01
CWSRF Q3 2026 Revenue Results
- Actual Revenue
- $229.03M
- Expected Revenue
- $247.24M
- Beat/Miss
- Missed by -$18.20M
- YoY Revenue Growth
- +15.17%
Earnings Announcement Details
- Quarter
- Q3 2026
- Date
- 11/05/2026
- Time
- After Close
- Conference Call
- Thursday, November 5, 2026
Chartwell Retirement Residences's next earnings date is estimated for March 4, 2027, based on past reporting schedules.
Q3 2026 Earnings Call Audio
No earnings call audio is available for this earnings event.
Q3 2026 Earnings Slide Deck
Q3 2026 Earnings Call Summary
The call was strongly positive overall. Chartwell reported substantial FFO, NOI, occupancy, margin, leasing, and engagement improvements, along with strong liquidity, embedded growth in its acquired portfolio, a large development pipeline, and continued acquisition activity. The main challenges were higher finance costs, compensation increases above historical norms, occupancy in the growth portfolio remaining below target, and the deferral or reevaluation of some development projects because of higher interest rates.
Management said staying below 4% on a DOE per occupied suite basis is achievable, with the number expected to get closer to the 4% level as occupancy stabilizes; total compensation increases are expected to remain between 4% and 5% in 2027, versus historical increases between 2% and 3%. The growth portfolio is expected within 12 months or so to achieve 95% average occupancy, while all platforms are expected to contribute to get to 96% portfolio wide; stabilized occupancy targets will not be changed. In strong markets with high occupancy, market rate increases can be high single digits, blending to 4% to 5% rental rate growth on average, and Greenway’s going-in cap yield is in the High-5s. Additional development projects are expected to start next year, but discussing quantum is premature, and new service programs are expected to be discussed more within the next 6 to 9 months.
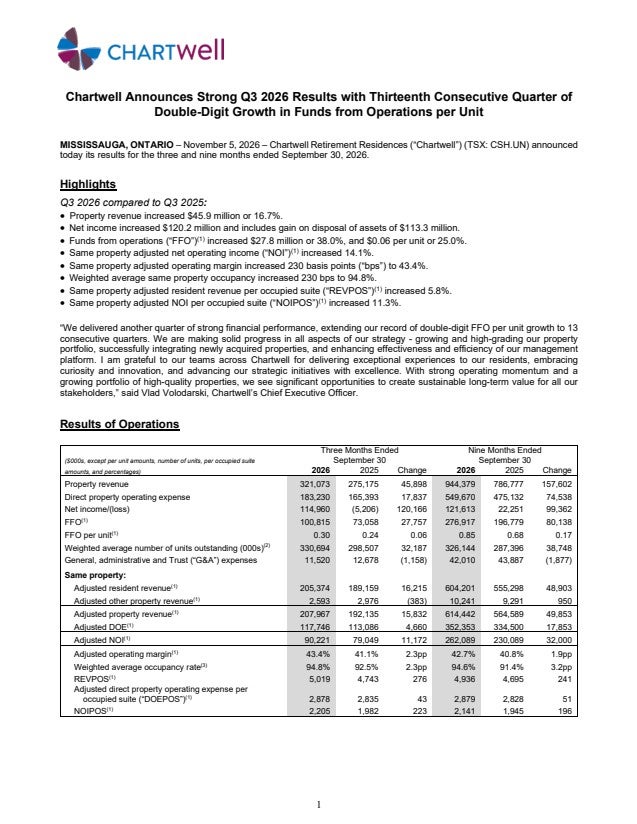
- Strong Third-Quarter FFO GrowthQ3 2026 FFO increased 38% to $100.8 million, or $0.30 per unit, compared with $73.1 million, or $0.24 per unit, in Q3 2025. FFO per unit increased 25%, marking the 13th consecutive quarter of double-digit FFO per unit growth.
- Net Income Rebounded SignificantlyNet income was $115 million in Q3 2026 compared with a net loss of $5.2 million in Q3 2025, primarily reflecting a $113.3 million gain on disposal of assets, higher property revenue, and other items.
- Year-to-Date FFO ExpansionFor the first nine months of 2026, FFO increased 40.7% to $276.9 million, while FFO per unit increased 25% to $0.85.
- Strong Same-Property Operating PerformanceQ3 same-property adjusted NOI increased 14.1%, or $11.2 million. Weighted average occupancy increased 230 basis points to 94.8%, adjusted operating margin increased 230 basis points to 43.4%, revenue per occupied suite increased 5.8%, and NOI per occupied suite increased 11.3%.
- Year-to-Date Same-Property ProgressYear-to-date same-property occupancy averaged 94.6%, revenue per occupied suite growth was 5.1%, and same-property adjusted NOI increased 13.9%. Direct operating expenses per occupied suite increased only 1.8% to $2.88 thousand, while NOI per occupied suite increased 10.1% to $2.14 thousand.
- Improved Operating MarginsYear-to-date adjusted operating margin for the stabilized same-property portfolio improved by 190 basis points to 42.7%. In Q3, adjusted operating margin improved to 43.4%.
- Positive Leasing MomentumThe company reported positive net permanent move-ins over permanent move-outs of 34 units, with contributions from all operating platforms. Personalized tours from marketing sources increased 26% quarter over quarter, and the conversion ratio from initial marketing contacts to personalized tours improved to 50% in Q3 2026 from 44% in Q3 2025.
- Marketing Campaign ReachThe La Presse campaign generated nearly 700 thousand impressions, over 120 thousand article reads, and 5.9 thousand website visitors. A collaboration with Sprout generated more than 1 million YouTube views and another 500 thousand Instagram views.
- Lower Staffing Agency CostsStaffing agency costs decreased 37% year-to-date in 2026 compared with 2025 through the company's continued focus on retention activities.
- Improved Resident and Employee Engagement ScoresThe resident Net Promoter Score was +58, considered excellent by international standards and 16 points higher than the 2025 baseline. The employee Net Promoter Score was +42, which was 3 points higher than the 2025 baseline.
- Progress on Property IntegrationOperations teams continued integration activities for six homes previously owned by Sifton, 17 Chartwell-Fengate properties previously known as Seasons properties, and the newly acquired Chartwell Palermo and Chartwell Greenway. The company also offboarded three non-core residences.
- Embedded Growth in the Growth PortfolioThe growth portfolio includes 52 properties and approximately 9.3 thousand suites at Chartwell's ownership share, representing approximately 35% of total suites. Q3 average occupancy was 91.6%, and closing the gap to the same-property target of greater than 95% represents approximately $14.7 million of annualized revenue opportunity.
- Strong Growth-Portfolio MarginDespite lower occupancy, the growth portfolio generated a 46% adjusted operating margin compared with 43.4% for the same-property portfolio, demonstrating the operating leverage available as occupancy increases.
- Balance Sheet and LiquidityAt November 5, 2026, liquidity was $573.4 million, consisting of $178.3 million of cash and cash equivalents and $395.1 million of available borrowing capacity. Net debt to adjusted EBITDA was 6.8x, interest coverage was 3.5x, and the consolidated weighted average interest rate was 4.03%.
- Improved NOI-to-FFO ConversionNOI-to-FFO conversion improved from approximately $0.48 of FFO per unit for each dollar of NOI per unit in 2023, to $0.58 in 2024 and $0.62 in 2025. Over the same period, FFO per unit increased from $0.55 to $0.95.
- Value Creation in Greater Montreal PortfolioSince acquiring five Greater Montreal Area residences in June 2024, occupancy increased by 600 basis points, revenue per occupied suite grew at a 6.6% compound annual rate, operating margin improved by 8.1 percentage points, and adjusted NOI grew at an 18.1% compounded annual rate. The company estimates that this performance created over $100 million in value, with the portfolio generating an implied NOI yield of 7.7%.
- Additional Expansion Potential in MontrealThe Greater Montreal portfolio includes 28 suites, 93 suites in development, 285 suites in predevelopment, and a further 202-suite opportunity. The portfolio could ultimately grow to approximately 2,008 suites.
- Portfolio Optimization and Capital RecyclingChartwell acquired the 237-suite Greenway Retirement Residence in Brampton, Ontario, for $136 million on September 1. It also sold one Ontario property for $91 million on the same date, a non-core property in Victoriaville, Quebec, for $8 million on October 1, and another property in Kitchener, Ontario, for $41.8 million.
- Large Development PipelineThe development pipeline comprises 38 projects representing approximately 9.46 thousand suites in British Columbia, Alberta, Ontario, and Quebec. Eight projects representing 1.47 thousand suites are under construction, while 30 projects representing 7.99 thousand suites are in predevelopment.
- Geographically Diversified Development PipelineThe pipeline includes approximately 2.6 thousand suites in British Columbia, 1.2 thousand suites in Alberta, 2,050 suites in Ontario, and 3.6 thousand suites in Quebec.
- Acquisition Pipeline and Market DemandManagement reported a strong acquisition pipeline for the next few quarters, with activity across all markets in which Chartwell operates. The company continues to see strong demand for both Class A assets and its non-core asset portfolio, with increased institutional interest in Class A assets and deep and broad interest in Class B assets.
- Revenue and Pricing OpportunityIncentives were 4.5% of resident revenue in Q3, down from 4.8% in the comparable prior period. Management said in-place increases are targeted to be just above inflation, market pricing is locally driven, and average rental rate growth is expected to blend to 4% to 5%. In strong markets with high occupancy, market rate increases can be in the high single digits or slightly higher.
- Continued Investment in Resident Services and TechnologyChartwell is continuing to enhance wellness, dining, activities, care, and support services while using simpler processes, technology, automation, and AI-enabled tools to make the organization more agile and efficient. The company also added a vice president of care experience and innovation.
- Continued Investment in GrowthThe company is continuing to invest in its residences, integrate newly acquired properties, advance portfolio optimization initiatives, and develop future growth through acquisitions, development partnerships, and repositioning selected residences.
CWSRF Earnings History
| Report Date | Fiscal Quarter | Forecast / EPS | Last Year's EPS | EPS YoY Change | Press Release |
|---|---|---|---|---|---|
| Mar 04, 2027 | 2026 (Q4) | ―- | 0.02 | ― | ― |
| Nov 05, 2026 | 2026 (Q3) | ―0.25 | -0.01 | 2147.06% (+0.26) | |
| Aug 06, 2026 | 2026 (Q2) | ―-0.00 | -0.01 | 80.00% (+0.01) | |
| May 07, 2026 | 2026 (Q1) | ―0.02 | 0.08 | -78.99% (-0.07) | |
| Feb 26, 2026 | 2025 (Q4) | ―0.02 | 0.01 | 76.92% (+0.01) | |
| Nov 06, 2025 | 2025 (Q3) | ―-0.01 | 0.06 | -119.77% (-0.07) | |
| Aug 07, 2025 | 2025 (Q2) | ―-0.01 | -0.01 | -81.82% (-0.01) | |
| May 08, 2025 | 2025 (Q1) | ―0.08 | -0.01 | 1587.50% (+0.09) | |
| Feb 27, 2025 | 2024 (Q4) | ―0.01 | -0.04 | 124.07% (+0.05) | |
| Nov 14, 2024 | 2024 (Q3) | ―0.06 | 0.46 | -86.83% (-0.40) |
The table shows recent earnings report dates and whether the forecast was beat or missed. See the change in forecast and EPS from the previous year.
