

Chartwell Retirement Residences (CWSRF) Q2 2026 Earnings Report
CWSRF Q2 2026 EPS Results
- Actual EPS
- $0.00
- Consensus EPS
- ―
- Beat/Miss
- ―
- One Year Ago EPS
- -$0.01
CWSRF Q2 2026 Revenue Results
- Actual Revenue
- $233.37M
- Expected Revenue
- $236.79M
- Beat/Miss
- Missed by -$3.42M
- YoY Revenue Growth
- +19.39%
Earnings Announcement Details
- Quarter
- Q2 2026
- Date
- 08/06/2026
- Time
- After Close
- Conference Call
- Thursday, August 6, 2026
Chartwell Retirement Residences's next earnings date is estimated for November 5, 2026, based on past reporting schedules.
Q2 2026 Earnings Call Audio
No earnings call audio is available for this earnings event.
Q2 2026 Earnings Slide Deck
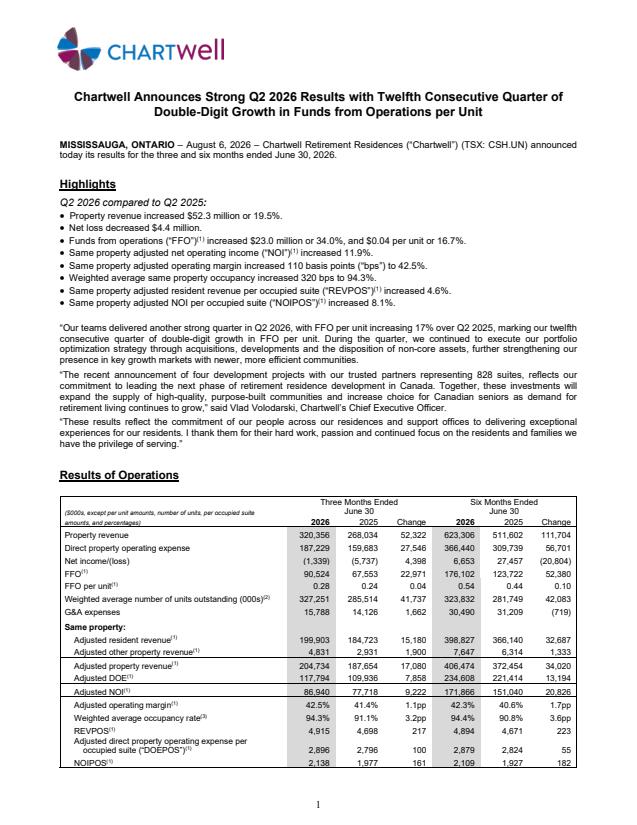
Q2 2026 Earnings Call Summary
The call communicated robust operating and financial momentum: meaningful FFO growth, occupancy gains, strong same-property NOI improvement, active accretive acquisitions and a growing development pipeline, supported by solid liquidity and integration execution. Key challenges include higher finance and G&A costs, leverage and upcoming debt maturities, expense timing volatility, and a narrowing discount to replacement cost on potential acquisitions. On balance the positives (strong earnings growth, portfolio optimization, pipeline and operational execution) outweigh the manageable risks highlighted.
The company reiterated its three‑year operating guidance of sustaining rate growth above 4% and keeping DOE (direct operating expense) growth below 4%, and said it expects same‑property occupancy to reach about 95% by September; Q2 metrics underpinning that guidance included FFO of $90.5M (+34% YoY) and FFO/unit up $0.04 (16.7%) to $0.28, FFO growth aided by $27.6M higher adjusted NOI, same‑property occupancy up 320 bps to 94.3%, same‑property adjusted NOI +$9.2M (+11.9%), NOI per occupied suite +8.1%, and platform same‑property NOI gains (Western +$4.4M / +19.5%, Ontario +$3.0M / +7.4%, Quebec +$1.8M / +12.3%); liquidity and financing targets cited to support growth include ~$614M total liquidity (cash $219M + $395M undrawn credit), an ATM/shelf capacity to raise up to $500M (recent ATM proceeds $72.7M), interest coverage ~3.5x, net debt/adjusted EBITDA ~7.0x, $2.2B unencumbered asset pool, near‑term 2026 maturities of $227.1M mortgages (WA rate 2.8%) and a $250M senior unsecured debenture at 6%, and market rate references (10‑yr CMHC ~4.17%, 5‑yr unsecured ~4.38%); growth pipeline metrics highlighted include YTD >$1B of acquisitions (23 properties, ~2,943 suites with Fengate), four new developments representing 828 suites, ~$3.2B invested in the last two years, $167M of non‑core sales completed (plus agreements to sell additional properties totalling ~$132.8M), and a signed GTA acquisition for ~$136M expected to close in Q3.
- Strong FFO GrowthFFO for Q2 2026 was $90.5 million, up 34% year-over-year; FFO per unit rose $0.04 or 16.7% to $0.28, marking the 12th consecutive quarter of double-digit FFO per unit growth.
- Occupancy and Same-Property PerformanceSame-property occupancy increased 320 basis points to 94.3% in Q2 2026; same-property adjusted NOI rose $9.2 million or 11.9%; NOI per occupied suite increased 8.1%.
- Regional Same-Property NOI GainsWestern Canada same-property adjusted NOI increased $4.4 million or 19.5%; Ontario increased $3.0 million or 7.4%; Quebec increased $1.8 million or 12.3%.
- Active, Strategic Growth and AcquisitionsYear-to-date the company completed and announced over $1 billion of acquisitions (including a 30% interest in the Seasons portfolio of 23 properties / 2,943 suites with Fengate); invested over $3.2 billion in acquisitions over the last two years.
- Development Pipeline ExpansionAnnounced four development projects representing 828 suites across Quebec, Alberta and British Columbia and disclosed a pipeline opportunity of roughly 6,400 potential suites across the portfolio; development model includes put/call structures and off‑balance sheet options.
- Portfolio Optimization and DispositionsCompleted $167 million of non-core asset sales in 2026 and announced agreements to sell additional properties totalling $132.8 million; net proceeds from nine non-core Ontario property sale were $82.3 million after mortgage payoffs and costs.
- Solid Liquidity and Financing FlexibilityLiquidity of approximately $614 million (≈ $219 million cash + $395 million undrawn credit capacity); unencumbered asset pool grew to $2.2 billion; raised $72.7 million gross via ATM program in the quarter.
- Operational Leasing Momentum and Marketing WinsNet permanent move-ins minus move-outs of +80 units in Q2 with contributions from all platforms; personalized tours up 11% quarter-over-quarter and marketing-to-tour conversion improved to 50% (from 44% in Q2 2025); new marketing campaign garnered millions of video views and strong brand perception (81% positive in La Presse study).
- Cost-Control and Integration SuccessesYear-to-date staffing agency costs reduced 43% vs. 2025 through recruitment/retention initiatives; multiple acquisitions (Sifton homes, Chartwell Fengate tranche) reported smooth integrations using structured 30/60/90/120-day playbook.
- Resident Experience and RecognitionOperational improvements yielded results such as Chartwell Churchill House occupancy rising from 78% in January to 92% in July and operating margin improving from ~48% to 53%; dining and nutrition awards received (People's Choice Award and Bonjour Résidence Signature Award).
CWSRF Earnings History
| Report Date | Fiscal Quarter | Forecast / EPS | Last Year's EPS | EPS YoY Change | Press Release |
|---|---|---|---|---|---|
| Nov 05, 2026 | 2026 (Q3) | ―- | -0.01 | ― | ― |
| Aug 06, 2026 | 2026 (Q2) | ―-0.00 | -0.01 | 80.00% (+0.01) | |
| May 07, 2026 | 2026 (Q1) | ―0.02 | 0.09 | -78.99% (-0.07) | |
| Feb 26, 2026 | 2025 (Q4) | ―0.02 | 0.01 | 76.92% (+0.01) | |
| Nov 06, 2025 | 2025 (Q3) | ―-0.01 | 0.06 | -119.77% (-0.07) | |
| Aug 07, 2025 | 2025 (Q2) | ―-0.01 | -0.01 | -81.82% (-0.01) | |
| May 08, 2025 | 2025 (Q1) | ―0.09 | -0.01 | 1587.50% (+0.09) | |
| Feb 27, 2025 | 2024 (Q4) | ―0.01 | -0.04 | 124.07% (+0.05) | |
| Nov 14, 2024 | 2024 (Q3) | ―0.06 | 0.47 | -86.83% (-0.41) | |
| Aug 08, 2024 | 2024 (Q2) | ―-0.01 | -0.02 | 64.52% (+0.01) |
The table shows recent earnings report dates and whether the forecast was beat or missed. See the change in forecast and EPS from the previous year.
