

Want to see CIB full AI Analyst Report?
Grupo Cibest (CIB) Q2 2026 Earnings Report
CIB Q2 2026 EPS Results
- Actual EPS
- $3.66
- Consensus EPS
- $2.39
- Beat/Miss
- Beat by +$1.27
- One Year Ago EPS
- $1.86
CIB Q2 2026 Revenue Results
- Actual Revenue
- $3.24B
- Expected Revenue
- $2.28B
- Beat/Miss
- Beat by +$957.09M
- YoY Revenue Growth
- +23.85%
Earnings Announcement Details
- Quarter
- Q2 2026
- Date
- 08/10/2026
- Time
- After Close
- Conference Call
- Monday, August 10, 2026
Grupo Cibest's next earnings date is estimated for November 5, 2026, based on past reporting schedules.
Q2 2026 Earnings Call Audio
No earnings call audio is available for this earnings event.
Q2 2026 Earnings Slide Deck
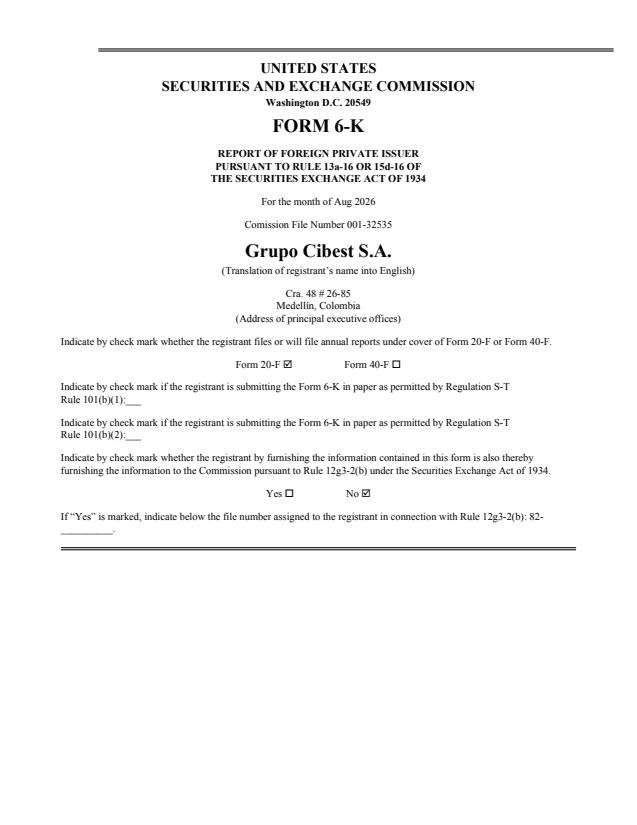
Q2 2026 Earnings Call Summary
The call conveyed strong underlying operational and financial momentum: record quarterly net income, materially expanded NIM and ROE, healthy fee growth, improved efficiency and disciplined capital actions (buybacks, extraordinary dividend, acquisitions). These positives were balanced against macro and event-driven headwinds — high inflation, elevated policy rates, fiscal pressures, peso appreciation, seismic and El Niño risks, and some concentrated asset-quality pressures (notably in consumer pockets and certain Central American segments). Management raised guidance for NIM and ROE while maintaining conservative cost-of-risk and loan-growth targets and emphasized capital strength and strategic initiatives (Nequi separation, Avista acquisition). Overall, the company appears well positioned to sustain returns but remains exposed to near-term macro and event risks that could pressure asset quality and margins.
Management updated 2026 guidance with loan growth unchanged at 7–8%, NIM raised to 7.4–7.6% (lending NIM ~8%, investment NIM ~3.5%), cost of risk maintained at 1.6–1.8%, an efficiency ratio around 48% and ROE lifted to 21–22%; at mid‑year they reported a quarterly annualized cost of risk of 1.6% and first‑half ROE of 21.5%. On capital, Bancolombia’s June CET1 was 12.1% and total solvency 13.9%, management expects standalone solvency of ~15.3% and group double‑leverage of ~105% by year‑end (appetite up to ~120%); corporate actions include a proposed extraordinary dividend of 1.2 trillion and an active 3‑year buyback (over 7 million shares, ~COP 967 billion repurchased in the last 12 months).
- Record Quarterly Net Income and ROENet income reached COP 2.7 trillion for the quarter, up 87% quarter-over-quarter, driving a historic quarterly ROE of ~28.7% (annualized ~29%) with Bancolombia stand-alone ROE of 36%.
- Strong NIM and Net Interest Income ExpansionNet interest income increased 16.5% quarter-over-quarter. Consolidated NIM expanded by 91 basis points to 7.9% (from 7.0%), lending NIM rose to ~8.3% (from 7.8%) and investment NIM improved materially (from 1.8% to 6%).
- Loan Growth and Portfolio DynamicsGross loan portfolio was almost flat quarter-over-quarter (expected), representing 5.7% year-over-year growth (9.6% net of FX). Mortgage loans grew 1.8% q/q and 12% y/y; consumer loans +0.5% q/q and +7.4% y/y, supported by vehicle lending, Nequi and credit cards.
- Deposit and Funding ResilienceDeposits increased 7% year-over-year (12% net of FX) and were broadly stable q/q (-0.2% q/q / +1.2% net of FX). Savings account growth drove deposit inflows and the group maintained a diversified, low-cost funding mix with 57% of funding from side deposits.
- Improved Asset Quality and Lower ProvisionsNet provision expense fell 17% quarter-over-quarter to COP 1 trillion and the quarterly annualized cost of risk declined to 1.6%, supported by recoveries and stable portfolio performance across geographies.
- Efficiency Gains and Expense ControlOperating expenses declined 10% quarter-over-quarter (benefitting from a prior-quarter wealth tax recognition) and only rose 1.9% year-over-year. Consolidated cost-to-income ratio improved to 43%; BAM efficiency ratio improved to 42.2% (from 44.5%) and Banco Agrícola to 47% (from 47.9%).
- Digital Ecosystem Momentum (Nequi, Wompi, Wenia)Nequi monetized user base reached 18 million with an activity ratio of 81.6%. Nequi deposits hit COP 7.6 trillion (+12% q/q) and its loan portfolio reached COP 2.2 trillion (+14% q/q). Wompi and Wenia expanded payments and digital asset capabilities, supporting ecosystem monetization.
- Capital Management and Shareholder ReturnsShareholders' equity grew 4.8% q/q. Bancolombia stand-alone CET1 was 12.1% and total solvency 13.9% as of June. Company executed share buybacks (~7 million shares, COP 967 billion over 12 months) and proposed an extraordinary dividend of COP 1.2 trillion from Banistmo sale proceeds.
- Upgraded GuidanceManagement raised NIM guidance to 7.4%–7.6% and ROE guidance to 21%–22% for 2026 while maintaining loan growth guidance at 7%–8% and cost of risk guidance at 1.6%–1.8%.
- Strategic M&A and Corporate ActionsCompleted acquisition of 100% of Avista Colombia (payroll lending) to expand low-risk lending capabilities and announced Nequi will operate as an independent financial entity under the holding from Sept 1, 2026, enabling focused strategy execution.
CIB Earnings History
| Report Date | Fiscal Quarter | Forecast / EPS | Last Year's EPS | EPS YoY Change | Press Release |
|---|---|---|---|---|---|
| Nov 05, 2026 | 2026 (Q3) | 2.96- | 2.37 | ― | ― |
| Aug 10, 2026 | 2026 (Q2) | 2.393.66 | 1.85 | 97.47% (+1.81) | |
| May 04, 2026 | 2026 (Q1) | 1.901.66 | 1.7 | -2.58% (-0.04) | |
| Feb 23, 2026 | 2025 (Q4) | 2.03-2.09 | 1.7 | -222.71% (-3.79) | |
| Nov 06, 2025 | 2025 (Q3) | 1.812.37 | 1.44 | 64.88% (+0.93) | |
| Aug 06, 2025 | 2025 (Q2) | 1.671.85 | 1.49 | 24.41% (+0.36) | |
| May 05, 2025 | 2025 (Q1) | 1.611.70 | 1.78 | -4.22% (-0.07) | |
| Feb 19, 2025 | 2024 (Q4) | 1.391.70 | 1.54 | 10.72% (+0.17) | |
| Nov 07, 2024 | 2024 (Q3) | 1.421.44 | 1.52 | -5.78% (-0.09) | |
| Aug 08, 2024 | 2024 (Q2) | 1.481.49 | 1.53 | -2.87% (-0.04) |
The table shows recent earnings report dates and whether the forecast was beat or missed. See the change in forecast and EPS from the previous year.
