

Want to see BLMN full AI Analyst Report?
Bloomin' Brands (BLMN) Q2 2026 Earnings Report
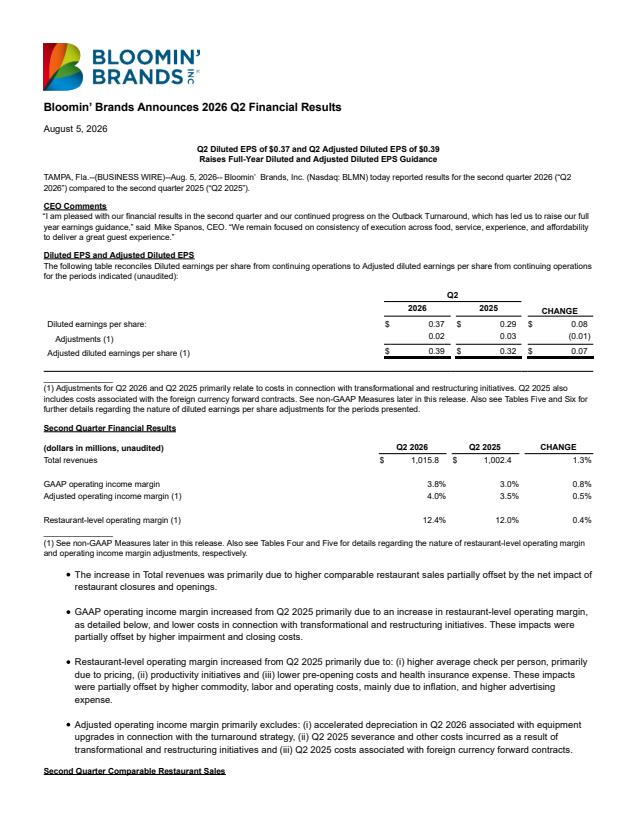
BLMN Q2 2026 EPS Results
- Actual EPS
- $0.39
- Consensus EPS
- $0.29
- Beat/Miss
- Beat by +$0.10
- One Year Ago EPS
- $0.33
BLMN Q2 2026 Revenue Results
- Actual Revenue
- $1.02B
- Expected Revenue
- $1.00B
- Beat/Miss
- Beat by +$13.76M
- YoY Revenue Growth
- +1.34%
Earnings Announcement Details
- Quarter
- Q2 2026
- Date
- 08/05/2026
- Time
- Before Open
- Conference Call
- Wednesday, August 5, 2026
Bloomin' Brands's next earnings date is estimated for November 6, 2026, based on past reporting schedules.
Q2 2026 Earnings Call Audio
Q2 2026 Earnings Slide Deck
Q2 2026 Earnings Call Summary
Balanced call highlighting measurable operational and financial progress — improved guest scores, comp sales, mix, margins, and raised full-year EPS guidance — while also acknowledging tangible near-term challenges including year-over-year traffic declines, commodity cost pressures, a negative Q3 EPS outlook, ongoing Brazil losses, and leverage above the company target. Management reduced planned turnaround spend and is reallocating marketing investment to drive brand relevancy; the path to sustainable traffic recovery is described as cumulative and not linear.
Guidance: Bloomin' Brands expects U.S. comparable restaurant sales of 1.0%–2.0% for fiscal 2026 with sales mix improving ~100 basis points, and now targets full‑year adjusted diluted EPS of $0.90–$1.00 (up from prior $0.75–$0.90). For Q3 2026 the company forecasts U.S. comp sales of 1.0%–2.0% and adjusted diluted EPS of negative $0.27 to negative $0.22, with an expected Q3 tax expense of ~ $5M (driven by a negative full‑year tax rate) and a Q3 impact from the 33% Brazil equity method investment of about negative $2M (full‑year Brazil loss ~ negative $3M–$4M). Capital and balance‑sheet guidance includes full‑year capex of $185M–$195M (Q2 capex $44M), total debt net of cash of $636M, lease‑adjusted net leverage of 3.7x (goal 3.0x), and net debt/adjusted EBITDA of 2.0x; marketing is up ~ $15M year‑over‑year (~3% of sales; ~$10M of that at Outback). Operational and cost context driving the guidance: Q2 revenue $1.02B (+1%), Q2 U.S. comps +230 bps (traffic -190 bps), Outback Q2 comp +140 bps (traffic -280 bps), average check +420 bps, off‑premises 24% of U.S. sales, Q2 adjusted EPS $0.39 (GAAP $0.37), adjusted operating margin 4.0% vs 3.5% prior year, commodity inflation running ~4.5%–5.5% (Q2 commodities +5.7%), turnaround investments trimmed to $36M (from $50M) with mix investment down to $4M (from $18M), productivity savings on track for $30M and net 2026 turnaround investment of ~$6M.
- Revenue and Comparable Sales ImprovementTotal revenues of $1.02 billion in Q2, up 1% year-over-year. U.S. comparable restaurant sales improved +230 basis points (2.3%) in Q2, narrowing the gap to industry comps.
- Earnings and Margin ProgressQ2 adjusted diluted EPS of $0.39 versus $0.32 last year (+21.9%); GAAP diluted EPS $0.37 versus $0.29 last year (+27.6%). Q2 adjusted operating margin expanded to 4.0% from 3.5% a year ago (+50 basis points).
- Brand-Level Momentum (Outback and Other Concepts)Outback Q2 comparable sales +140 basis points (1.4%) with notable improvements in guest metrics; Carrabba's comps +170 basis points (1.7%), Bonefish comps +810 basis points (8.1%) with traffic +450 basis points (4.5%), and Fleming's comps +160 basis points (1.6%). Carrabba's sixth and Fleming's eighth consecutive quarter of positive comp sales.
- Guest Experience and Service EnhancementsOutback Guest Metric Scores improved for the fourth consecutive quarter: service +7 points, atmosphere +7, value +6, intent to return +5, food +4, brand trust +2. Service model changed from 1:6 to 1:4 tables at peak; Q2 absolute service top-box >90% and up nearly 3 points year-over-year.
- Higher Check and Mix ImprovementsAverage check increased +420 basis points (4.2%) year-over-year. Management noted improved mix driven by premium steak trade-ups, successful combo/menu design, premium sides/toppers and stronger dessert and mocktail performance; Outback mix improvement reduced required mix investment from $18M to $4M.
- Turnaround Cost Discipline and Lowered Investment NeedsTurnaround investments revised down to $36M from $50M; non-guest-facing productivity savings on track for $30M, producing a net 2026 turnaround investment of ~$6M. This reduction contributed to raising full-year adjusted EPS guidance to $0.90–$1.00 (from $0.75–$0.90).
- Capital Allocation and Refresh ProgressQ2 capital expenditures $44M; full-year capex expected $185M–$195M. Approximately 31 Outback refreshes completed through July and ~85 expected for full year 2026; plan to touch nearly all Outback restaurants by end of 2028 with an average refresh spend of $350K–$400K each.
- Marketing Investment to Support TurnaroundPlanned increase of roughly $15M in advertising versus prior year (about 3% of sales), with ~ $10M incremental spend at Outback and second-half weighted deployment emphasizing digital/social alongside TV to drive brand relevancy and recruitment of younger cohorts.
BLMN Earnings History
| Report Date | Fiscal Quarter | Forecast / EPS | Last Year's EPS | EPS YoY Change | Press Release |
|---|---|---|---|---|---|
| Nov 06, 2026 | 2026 (Q3) | -0.24- | -0.03 | ― | ― |
| Aug 05, 2026 | 2026 (Q2) | 0.290.39 | 0.33 | 18.18% (+0.06) | |
| May 06, 2026 | 2026 (Q1) | 0.570.67 | 0.58 | 15.52% (+0.09) | |
| Feb 25, 2026 | 2025 (Q4) | 0.240.25 | 0.22 | 13.64% (+0.03) | |
| Nov 06, 2025 | 2025 (Q3) | -0.12-0.03 | 0.21 | -114.29% (-0.24) | |
| Aug 06, 2025 | 2025 (Q2) | 0.290.33 | 0.51 | -35.29% (-0.18) | |
| May 07, 2025 | 2025 (Q1) | 0.570.58 | 0.7 | -17.14% (-0.12) | |
| Feb 26, 2025 | 2024 (Q4) | 0.370.22 | 0.75 | -70.67% (-0.53) | |
| Nov 08, 2024 | 2024 (Q3) | 0.200.21 | 0.44 | -52.27% (-0.23) | |
| Aug 06, 2024 | 2024 (Q2) | 0.580.51 | 0.74 | -31.08% (-0.23) |
The table shows recent earnings report dates and whether the forecast was beat or missed. See the change in forecast and EPS from the previous year.
