

Want to see ANGPY full AI Analyst Report?
Anglo American Platinum (ANGPY) AI Stock Analysis

Anglo American Platinum
(Other OTC:ANGPY)
The overall score of 78 is primarily supported by a very strong financial foundation, marked by a debt-light balance sheet and robust cash flows, combined with an attractive valuation featuring a low P/E and high dividend yield. Technicals confirm a positive trend, though momentum indicators suggest the rally is not currently accelerating. The lack of earnings call guidance is a neutral factor.
Anglo American Platinum (ANGPY) vs. SPDR S&P 500 ETF (SPY)
- Market Cap
- $16.70B
- Dividend Yield
- 9.38%
- Average Volume (3M)
- 120.33K
- Price to Earnings (P/E)
- 7.8
- Beta (1Y)
- 1.11
- Revenue Growth
- 69.07%
- EPS Growth
- 2875.81%
- Country
- US
- Employees
- 20,158
- Sector
- Basic Materials
- Sector Strength
- 61
- Industry
- Other Precious Metals
Anglo American Platinum Business Overview & Revenue Model
Company Description
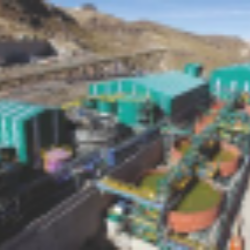
Valterra Platinum Ltd. functions as a holding company primarily engaged in the provision of platinum group metals (PGMs). The firm's expertise spans the acquisition and distribution of these critical elements, including palladium, platinum, rhodium,...
How the Company Makes Money
Anglo American Platinum makes money primarily by producing and selling platinum group metals. Its revenue model is vertically integrated: (1) it mines PGM-bearing ore from its operations, (2) processes that ore through concentrators to produce PGM-ri...
Anglo American Platinum Earnings Call Summary
The call conveyed a strongly positive operational and financial narrative: revenue and EBITDA growth, substantial cost savings, a swing to net cash, robust free cash flow and generous shareholder returns. These positives were supported by tangible operational improvements (Mogalakwena efficiencies, processing optimizations, project progress at Sandsloot/Der Brochen) and sustainability credentials. Headwinds included two workplace fatalities, weather/flood impacts (Amandelbult), input cost inflation, one-off demerger costs, some inventory/volume adjustments and localized cash access issues at Unki. Overall, the achievements and outlook materially outweigh the challenges, yielding a favorable view of the company’s trajectory while noting targeted risks to monitor.
Q4-2025 Updates
Positive Updates
Negative Updates
Company Guidance
Guidance summary: For 2026 the group targets M&C/refined production of about 3.0–3.4Moz (Mogalakwena maintained at ~0.9–1.0Moz), Amandelbult expected to recover ~25%, group all‑in sustaining cost guidance is ~US$1,050/3E oz (assumes ZAR17/USD) after 2025 AISC of US$987/3E oz (US$1,039 including life‑extension capital), cash operating unit cost guidance ZAR19,000–20,000/PGM oz (2025: ZAR19,488), and total capital expenditure of ZAR17–18bn (sustaining ZAR12.5bn; discretionary ZAR4.5–5bn); Sandsloot work is budgeted within the envelope with project spend guidance ~ZAR1.5–2.5bn and prefeasibility indicating a 10–50% uplift in Mogalakwena volumes and 10–20% cost reduction, the company targets net debt/EBITDA <1x (ended 2025 with ZAR11.5bn net cash, ZAR20bn sustaining free cash flow and ZAR43bn liquidity headroom), customer prepayment ~ZAR12.8bn (contract through 2027 under renegotiation), ZAR5bn of cost savings delivered in 2025 with a further ZAR1–1.5bn targeted for 2027 (ZAR18bn total cost & capital savings over 24 months), and a balanced capital allocation that returned ~ZAR12bn of dividends in 2025 (~ZAR45/sh total; final dividend ~ZAR11.5bn or ~ZAR43/sh) while retaining a 40% headline‑earnings base dividend policy.
Anglo American Platinum Financial Statement Overview
Summary
Financial performance is strong, driven by an exceptionally robust balance sheet (Score 90) with minimal debt, and solid cash flow generation (Score 80) with high free cash flow conversion. Profitability has rebounded significantly, though revenue stabilization remains a minor concern.
Income Statement
70PositiveBalance Sheet
90Very PositiveCash Flow
80Positive| Breakdown | TTM | Dec 2025 | Dec 2024 | Dec 2023 | Dec 2022 | Dec 2021 |
|---|---|---|---|---|---|---|
Income Statement | ||||||
| Total Revenue | 151.54B | 107.74B | 108.99B | 124.58B | 164.09B | 214.57B |
| Gross Profit | 52.92B | 26.45B | 18.22B | 21.01B | 70.51B | 105.11B |
| EBITDA | 58.91B | 32.44B | 18.60B | 24.74B | 72.90B | 113.53B |
| Net Income | 35.54B | 14.28B | 7.06B | 13.04B | 49.15B | 78.98B |
Balance Sheet | ||||||
| Total Assets | 184.73B | 170.50B | 170.94B | 169.22B | 176.91B | 180.15B |
| Cash, Cash Equivalents and Short-Term Investments | 27.92B | 16.59B | 24.48B | 24.68B | 31.64B | 56.77B |
| Total Debt | 3.30B | 5.27B | 8.66B | 7.63B | 458.00M | 612.00M |
| Total Liabilities | 76.60B | 71.66B | 68.83B | 69.18B | 79.95B | 77.80B |
| Stockholders Equity | 107.71B | 98.45B | 101.74B | 99.61B | 96.78B | 102.21B |
Cash Flow | ||||||
| Free Cash Flow | 40.98B | 11.28B | 7.86B | -4.34B | 28.46B | 82.86B |
| Operating Cash Flow | 57.82B | 27.32B | 26.83B | 16.55B | 45.36B | 96.49B |
| Investing Cash Flow | -16.17B | -15.62B | -17.61B | -16.30B | -10.96B | -9.84B |
| Financing Cash Flow | -25.20B | -18.43B | -8.33B | -7.75B | -57.52B | -57.81B |
Anglo American Platinum Technical Analysis
Price Trends
Market Momentum
Evaluating momentum and price trends is crucial in stock analysis to make informed investment decisions. For ANGPY, the sentiment is Negative. The current price of 10.77 is below the 20-day moving average (MA) of 12.13, below the 50-day MA of 13.38, and below the 200-day MA of 13.51, indicating a bearish trend. The MACD of -0.56 indicates Positive momentum. The RSI at 30.00 is Neutral, neither overbought nor oversold. The STOCH value of 9.66 is Positive, not indicating any strong overbought or oversold conditions. Overall, these indicators collectively point to a Negative sentiment for ANGPY.
Anglo American Platinum Peers Comparison
Overall Rating
- ANGPY78Outperform
 HL76Outperform
 BVN74Outperform
 MUX68Neutral
 SBSW55Neutral
Financial Indicators
| Name | Overall Rating | Market Cap | P/E Ratio | ROE | Dividend Yield | Revenue Growth | EPS Growth |
|---|---|---|---|---|---|---|---|
| ANGPY | 78Outperform | $16.96B | 7.78 | 35.19% | 9.38% | 69.07% | 2875.81% |
| HL | 76Outperform | $9.09B | 27.06 | 12.98% | 0.14% | 51.13% | 399.24% |
| BVN | 74Outperform | $7.27B | 5.96 | 27.66% | 4.30% | 67.75% | 122.36% |
| MUX | 68Neutral | $860.86M | 9.91 | 13.47% | ― | 47.73% | ― |
| Sector * | 61Neutral | $10.43B | 7.12 | -0.05% | 2.87% | 2.86% | -36.73% |
| SBSW | 55Neutral | $6.06B | 6.26 | 34.68% | 9.36% | 59.20% | ― |
* Basic Materials Sector Average
Performance Comparison
| Show on chart | Ticker | Company Name | Price | Change | % Change |
|---|---|---|---|---|---|
| ANGPY | Anglo American Platinum | 10.77 | 0.98 | 10.04% | |
| BVN | Compania de Minas Buenaventura SAA | 26.42 | 5.22 | 24.63% | |
| HL | Hecla Mining Company | 13.53 | 0.78 | 6.13% | |
| MUX | McEwen Mining Inc | 14.03 | -4.04 | -22.36% | |
| SBSW | Sibanye Stillwater Limited | 8.59 | -1.31 | -13.21% | |
| SSMR | Sunshine Silver Mining & Refining Co. | 12.28 | -4.87 | -28.40% |
Disclaimer
This AI Analyst Stock Report is automatically generated by our AI systems using advanced algorithms and publicly available financial, technical, and market data. While the information provided aims to be accurate and insightful, it is intended for informational purposes only and should not be considered financial advice. Any content created by an AI (Artificial Intelligence) system may contain inaccuracies and/or contain errors. Investing in stocks carries inherent risks, and past performance is not indicative of future results. This report does not account for your personal financial circumstances, objectives, or risk tolerance. Always conduct your own research or consult with a qualified financial advisor before making investment decisions. The analysis and recommendations provided are based on historical and current data and may not fully reflect future market conditions or unexpected developments. Neither the creators of this report nor its affiliated entities guarantee the accuracy, completeness, or reliability of the information presented. Use this report at your own discretion and risk.
Date of analysis: Aug 28, 2026