


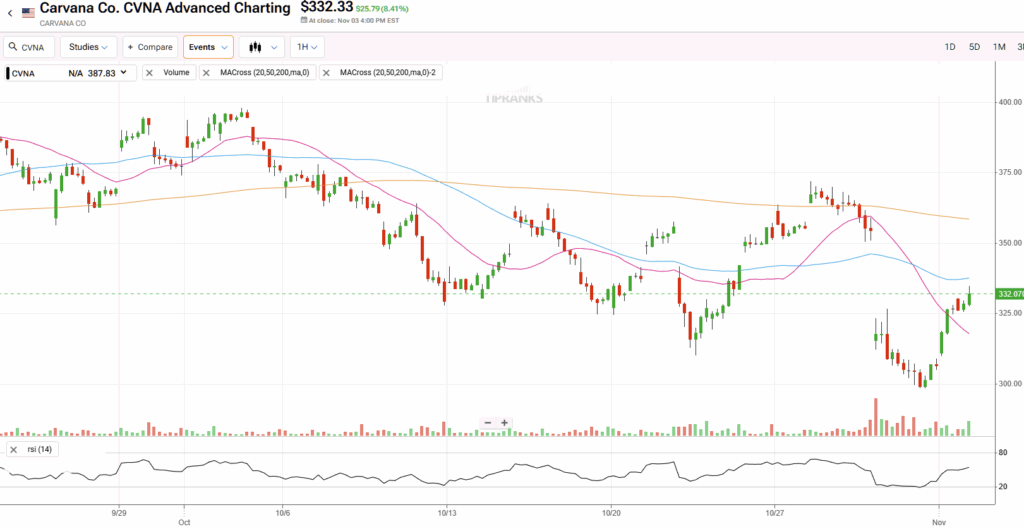
It wasn’t exactly the market performance that Carvana (CVNA) likely had in mind when it released its Q3 earnings report last week. On paper, circumstances appeared incredibly auspicious, with the used-car retailer posting record growth and an optimistic outlook. Still, a key detail may have triggered anxieties, leading to a 14% stock price decline by Friday’s close. Nevertheless, the red ink may also present an upside opportunity for adventurous traders.
Elevate Your Investing Strategy:
- Take advantage of TipRanks Premium at 50% off! Unlock powerful investing tools, advanced data, and expert analyst insights to help you invest with confidence.
So far this week, the stock has bounced from its $300 lows back up to ~$330 heading into Wednesday’s trade.
In Q3, Carvana generated earnings per share of $1.03, representing a 61% lift against the year-ago quarter. Excluding the impact of the decline in the value of Root warrants, EPS would have landed at $1.50. Wall Street analysts were anticipating a print of $1.30. Additionally, the company generated revenue of $5.65 billion, translating to a 55% jump from one year ago. This figure also beat out the consensus view, which stood at $5.11 billion.
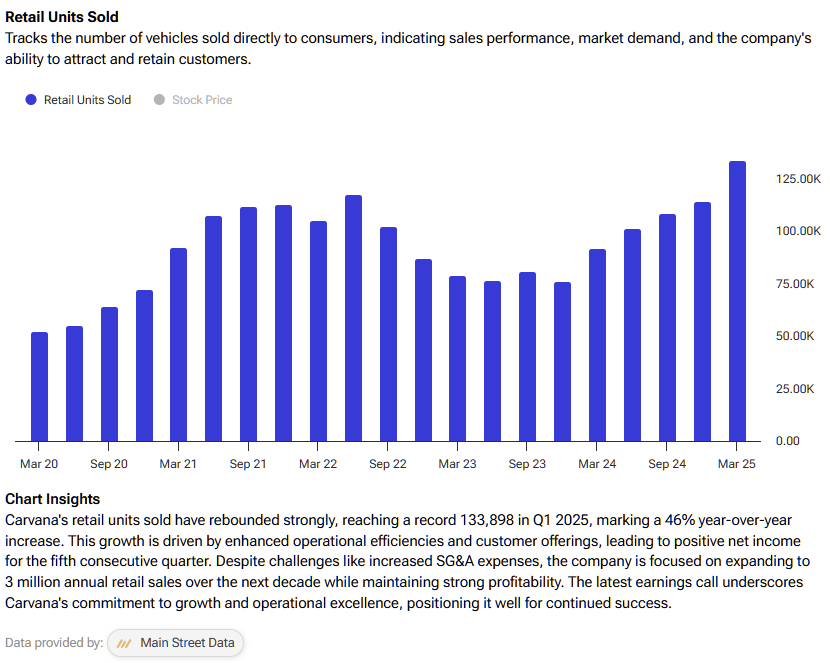
During Q3, Carvana sold 155,941 units, representing 44% year-over-year growth. For Q4, the company expects to sell 150,000 units, along with an adjusted EBITDA at or above the high end of its previously communicated range of $2 billion to $2.2 billion for the full year (2025).
Unfortunately, investors appeared to be hung up on the 40 basis points decline in the adjusted EBITDA margin to 11.3% in Q3, leading to a sharp decline in CVNA stock. However, the volatility seems to ignore the strong positives. As well, CVNA appears to be flashing a quantitative reversal signal, presenting an information arbitrage opportunity. Given the sharp rebound since last week, perhaps the market thinks so too.
Knowing Your Numbers is Key to Success in the Options Market
When dealing with the financial market — and especially options — every participant must know their statistics; specifically, the baseline probability and the conditional probability. The former refers to the odds associated with market behavior under normal or homeostatic circumstances, while the latter centers on the behavioral propensity of the specific condition at hand.
What’s crucial to grasp is the subtle interplay between these two probabilistic distributions. Rather than relying on fundamental or technical analysis—which both have their merits but aren’t the focus here—we can apply probabilistic modeling to estimate where a stock might move. In my view, a data-driven, empirical approach to the market is far more effective. While a quantitative methodology doesn’t ensure success, it helps eliminate emotional bias and focuses instead on the market’s inherent tendencies.
Identifying a Clear Target for CVNA Stock
Using data going back to January 2019, the forward 10-week outcomes would be expected to form a skewed distributional curve, with median prices ranging from $290 to $365 (assuming an anchor price of $306.54). Most importantly, price clustering would be expected to be predominant at $319, a byproduct of CVNA stock enjoying an upward bias.
However, the argument is that the current sentiment regime is different from the baseline state. In the past 10 weeks, CVNA stock has been structured in a 6-4-D formation: six up weeks, four down weeks, with an overall downward slope. Under this setup, the forward 10-week distributional curve is expected to shift with a bullish bias. Specifically, the risk tail doesn’t change at $290 while the reward tail jumps out to $410.

Moreover, the biggest takeaway here is that under 6-4-D conditions, price clustering would be predominant at $365. As such, you’re looking at a positive delta in price density dynamics of 14.42%. That’s an informational arbitrage because — if I may be brutally honest here — the fundamental and technical approaches are too stupid to pick up this variance.
What’s notable is that every single stock exhibits this kind of variance. Unfortunately, because a truly quantitative approach would render many traditional roles obsolete, less rigorous models are allowed to persist. But by studying and engaging with this material, you’re part of the resistance — and that’s no exaggeration.
Using the above market intelligence, there are two tempting ideas to consider. Those who are truly willing to take a risk may consider the 350/360 bull call spread expiring on December 19. This transaction involves buying the $350 call and simultaneously selling the $360 call, resulting in a net debit paid of $300 (the maximum potential loss).
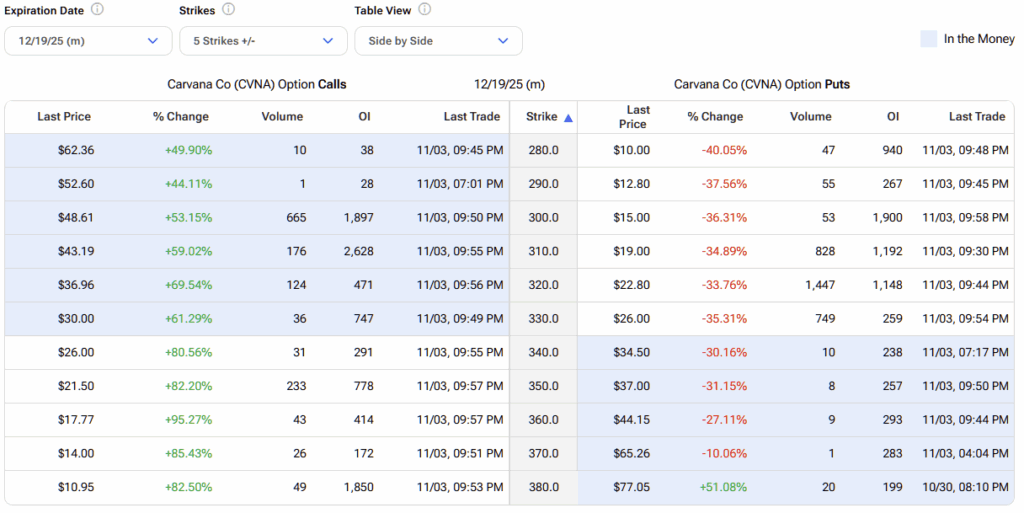
If CVNA stock rises through the second-leg strike of $360 at expiration, the maximum profit is $700, a payout of over 233%. Further, breakeven lands at $353, which is realistic considering the aforementioned projected density dynamics.
Those who want to take a more conservative approach may consider the 330/350 bull spread, also expiring on December 19. This trade is probabilistically easier to succeed with because the second-leg strike is only $350, with a breakeven at $338.15. However, the max payout drops to 145.4%. Additionally, the required net debit increases to $815.
Is Carvana Stock a Buy, Sell, or Hold?
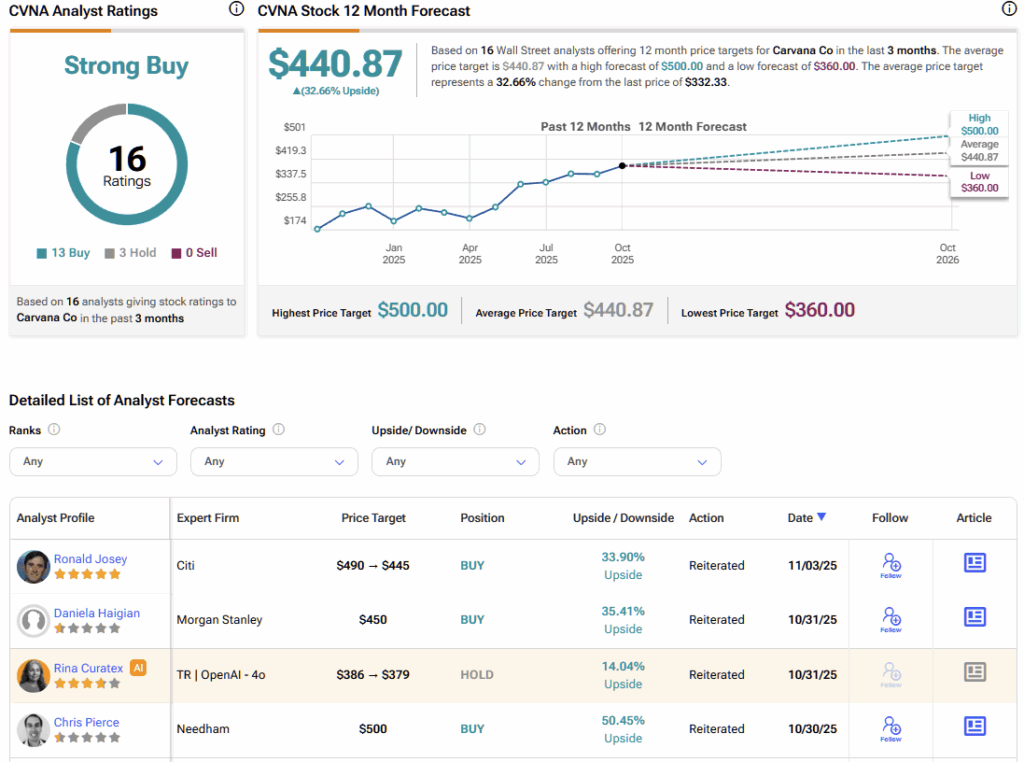
Turning to Wall Street, CVNA stock has a Strong Buy consensus rating based on 13 Buys, three Holds, and zero Sell ratings obtained over the past three months. The average CVNA price target is $440.87, implying 32% upside potential over the next 12 months.
How Quantitative Analysis Can Filter Out the CVNA Noise
Although Carvana’s intricate earnings disclosure triggered significant volatility in CVNA’s stock, the resulting red ink actually represents a data-backed opportunity. Traditional methods—whether fundamental or technical analysis—struggle to detect this signal, as they operate on epistemologically inferior frameworks.
It’s like trying to navigate the Paris catacombs without a flashlight: you might move forward, but you’re essentially blind to what matters most. By contrast, a quantitative approach illuminates the underlying market dynamics, allowing us to identify and exploit the subtle informational arbitrage others overlook. In this light, volatility isn’t chaos—it’s opportunity disguised as noise.