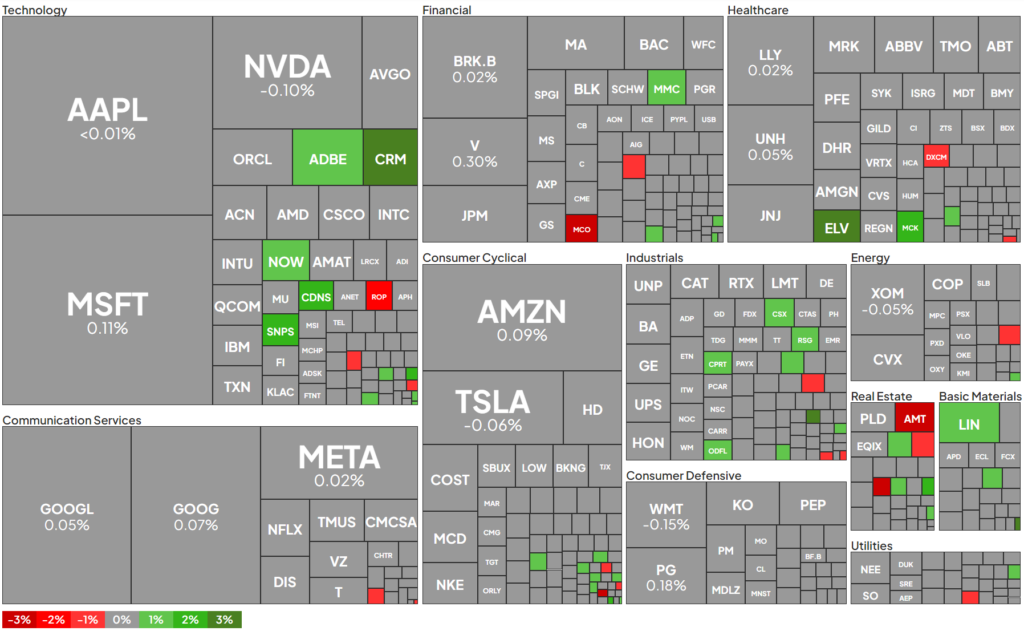
Another day of stock market trading has come to an end. Today’s action can be visualized with the S&P 500 Heatmap (SPX), which highlights the performance of each sector’s major stocks. For clarity’s sake, each box is scaled to reflect the relative size of the stocks within the index.
Confident Investing Starts Here:
- Easily unpack a company's performance with TipRanks' new KPI Data for smart investment decisions
- Receive undervalued, market resilient stocks right to your inbox with TipRanks' Smart Value Newsletter
Here’s a look at today’s heatmap at the close of trading:

It’s worth noting that this tool isn’t exclusive to the S&P 500 – it is also available for the Dow Jones (DIJA), the Nasdaq (NDX), and a wide variety of ETFs
Looking for a trading platform? Check out TipRanks' Best Online Brokers , and find the ideal broker for your trades.
Report an Issue


