


As the new year begins, TipRanks has released three new exciting new features to power your portfolio and maximize your investments:
1. “Best Analyst Covering” tool
2. Insider Trading information on the chart
3. Futures Dashboard
1. “Best Analyst Covering” Tool
We have developed a new tool called “Best Analyst Covering.” The goal of the tool is to help users identify which analyst covering a specific stock has given the most successful ratings.
Our rankings at TipRanks are based on the overall performance of an analyst across all the stocks they cover, as determined by the ratings they give to stocks and the subsequent returns on those ratings. Of course, an analyst may be more successful when covering some stocks, but less successful when covering others.
Our new “Best Analyst Covering” tool shows you which analyst made the best calls on a particular stock. We further break down the data by showing best analyst on a stock per time periods: one month, three months, one year, and two years.
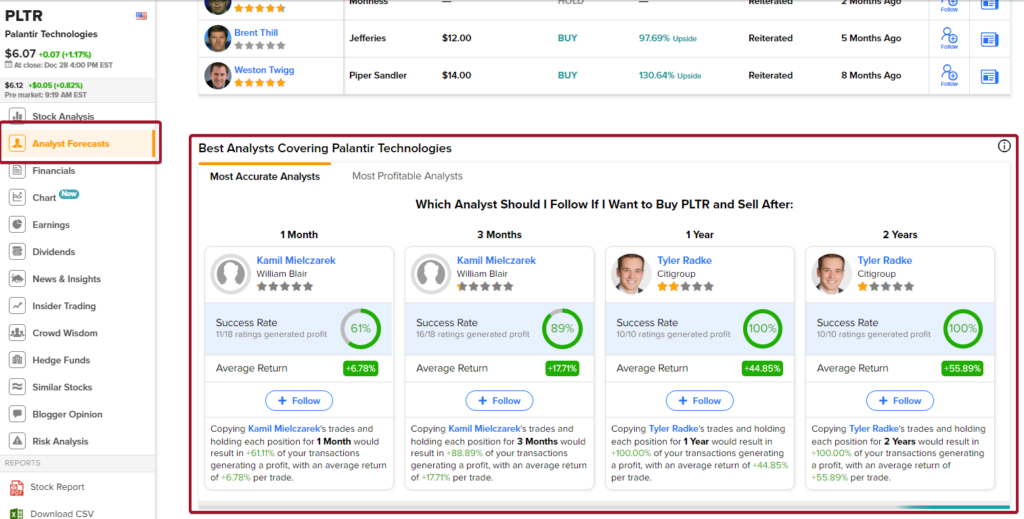
The tool can be found in the Analyst Forecast tab on our individual stock pages, just under the table of analyst forecasts.
To understand how the tool works, consider the following analogy: Imagine you’re the coach of a basketball team and you need to make a crucial 3-point shot in order to win the game. Who would you choose to take the shot? LeBron James, the best overall basketball player, or Steph Curry, the best 3-point shooter? Similarly, when considering investing in a specific stock, such as Palantir Technologies (PLTR), wouldn’t you want to know who the best performing analyst is for that stock? Just as you would choose Steph Curry to take the 3-point shot, you can use our tool to identify the best analyst for the stock you’re interested in.
For example, let’s say that you have an investment or are considering investing in PLTR. The best analyst overall, out of all the analysts who have given ratings on PLTR, is 5-star analyst Weston Twigg. However, his rating is based on the ratings he has given to all stocks, not just Palantir Technologies (PLTR). Weston (the LeBron James in the analogy) boasts an overall success rate of 72% and an average return of 28.4% per rating.

However, when it comes to PLTR specifically, Weston Twigg has not performed nearly as well as he has overall. In fact, as of January 2023, he has a 0% success rate on his PLTR ratings, with an average return of -39.32% per rating.

In contrast, Tyler Radke (the Steph Curry in the analogy), a 2.3-star analyst, has a success rate of 100% on his 10/10 ratings for PLTR, with an average return of 44.85% per rating. Therefore, an investor who followed Radke’s recommendations on PLTR would have yielded a hefty return.

As you can see, the tool can help investors identify analysts with a strong track record of accurately predicting the performance of a specific stock, which can be valuable information when making investment decisions.
How to Use the “Best Analyst Covering” Tool
The tool allows you to see which analyst is best at covering a specific stock during four different holding periods: 1 month, 3 months, 1 year, and 2 years. This means that the performance you see in each of those options is the performance you could have seen in your personal portfolio, if you had bought the stock when the analyst gave a recommendation and then held it for the duration of one of the four periods.
The tool has two tabs:
- Most Accurate Analysts – this tab shows you the 4 analysts that have the best success rate on the stock for the four different holding periods, regardless of their average return.
- Most Profitable Analysts – this tab shows you the 4 analysts that have the best average return on the stock, regardless of their success rate.

Example:
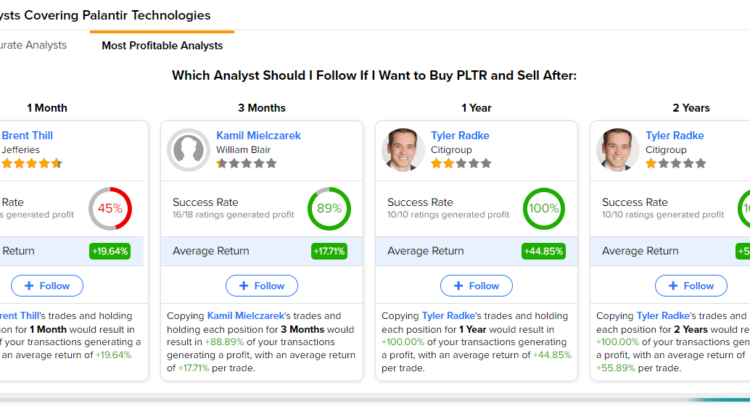
If you are looking to buy PLTR stock and hold it for a duration of one month, and you want to maximize your profits even if it’s by a small margin, you should follow Kamil Mielczarek. For that specific timeframe, he has the best success rate out of all the analysts covering PLTR.

On the other hand, if you are looking to buy PLTR stock and hold it for a duration of one month, and you want to maximize your profits regardless of the success rate, you should follow Brent Thill. For that specific timeframe, he has the best average return out of all the analysts covering PLTR.

2. Insider Trading Information on Charts
We have also added insider trading information to our Charts. Insider trading refers to the buying or selling of a company’s securities by company insiders, such as directors, officers, and key employees. Insider trading activity can be a useful indicator of a company’s financial health and future performance, as insiders are typically well-informed about the company’s operations and prospects.
There are two way to access the insider trading information on the chart:
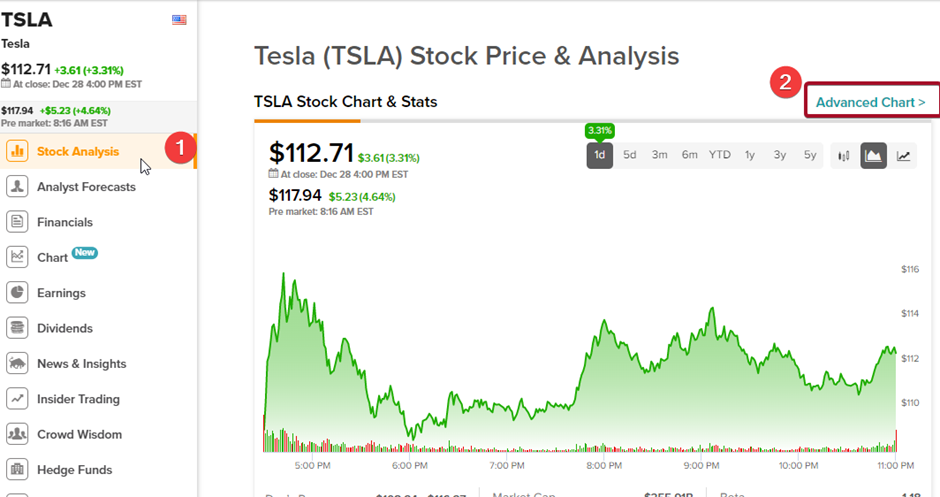
- Click the “Advanced Chart” link in the Stock Analysis tab
- Click the “Chart” tab

- Then click on the “Events” drop-down menu and choose “Insiders”

The Insider Trading information is now displayed on the chart. Green and purple boxes represent informative Buy and Sell transactions, while the grey boxes represent uninformative transactions such as Grants, Automatic Sell Plans, etc.
To interpret the insider trading information, you can consider the following factors:
- The number of shares bought or sold: If there is a large number of shares being bought or sold by insiders, this may indicate a strong belief in the company’s future performance.
- The value of the transactions: If the value of the transactions is high, this may suggest that insiders are confident in the company’s future prospects.
- The summary of insider trading activity: If a large number of insiders are buying or selling shares, or if a high percentage of the company’s shares are owned by insiders, this may indicate a strong level of insider sentiment about the company’s future performance.
The image below shows an informative Sell transaction on Tesla stock by Elon Musk, valued at $4B. It is very clear that following the disclosure of this transaction, the stock price reacted towards the downside. The insider trade, along with other factors, seemingly had a negative impact on Tesla’s stock price.

3. Futures Dashboard
Ever wished to be able to track futures in real-time on the platform that also allows you to track your investments? TipRanks is bringing you just that. TipRanks’ website now displays the live movements of the U.S. stock market index futures. This not only makes it easier to gauge how the stock market might perform the following day, but also helps in the decision-making process of futures traders.
Futures are displayed on the dashboard as “US 500 Futures,” which tracks the derived futures contracts on the S&P 500 index (SPX), “US 30 Futures” for the derived futures on the Dow Jones Industrial Average (DJIA), and “US Tech 100 Futures” for the derived futures on the Nasdaq 100 index (NDX).
All of TipRanks’ derived Futures are real-time and not delayed.
Why Trade Futures?
Futures trading is an excellent way to manage risky assets and hedge against volatility. Also, because futures contracts are traded in large numbers on a regular basis, the futures market is very liquid. There is a steady flow of buyers and sellers, guaranteeing that market orders are executed swiftly and easily.
Other benefits of futures trading include lower commissions and costs of trading as well as tax benefits.
TipRanks’ real-time display of futures movements makes it easier to track how the futures on the three major stock market indexes are performing. For futures traders, this can help build the course of their trading patterns. On the other hand, for regular traders and investors, this can help understand whether there is an upside to the indexes or a potential decline in store.
Using the Futures Dashboard
TipRanks displays futures on Sunday to Friday, from four hours after the U.S. market closes until the opening bell the following day.
The website stops showing futures four hours after the U.S. market closes every Friday and displays them again the following Sunday night. Apart from weekends, the futures display rests on holidays too.

During the hours that Futures are displayed on TipRanks, find them on the home page, where they are shown on the top of the page, directly beneath the menu. You can navigate to TipRanks’ home page at any time by clicking on the TipRanks logo on the upper left-hand corner of the page.

Conclusion
These three new features – the “Best Analyst Covering” tool, the inclusion of insider trading information on our Charts, and the Futures Dashboard – will certainly be useful for investors as they make informed decisions about their investments. By providing access to important information about futures, the performance of analysts and insider trading activity, these tools can help investors identify trends and make more informed decisions. We will continue to develop and improve these tools in order to provide the best possible experience for our users.
Thank you for using our platform, and we hope you find these new features helpful. If you have any questions or feedback, please don’t hesitate to contact us at [email protected]. We are always happy to help boost your investing.