


Since the beginning of 2022, markets have become extremely volatile, making it difficult to make investment decisions. To address the issue, TipRanks’ recently launched the All-In-One Technical Analysis tool, which offers a variety of technical indicators to help you make better-informed investment decisions. Let’s look at the Technical Analysis pages of two of the most followed ETFs, JEPI and SCHD, and see what signals they are currently generating for each.
Pick the best stocks and maximize your portfolio:
- Discover top-rated stocks from highly ranked analysts with Analyst Top Stocks!
- Easily identify outperforming stocks and invest smarter with Top Smart Score Stocks
To find the new Technical Analysis page, simply go to any stock or ETF page and you will see it in the menu on the left side of the page.

JPMorgan Equity Premium Income ETF (JEPI)
The JPMorgan Equity Premium Income ETF aims to offer lower volatility coupled with regular monthly income. To achieve this, portfolio managers actively manage JEPI and invest only in large-cap U.S. stocks and equity derivatives such as equity-linked notes (ELNs).
When we go to the ETF technical analysis page, the default reading will be for 1 Day. You can change the reading for a different period ranging from 1 Minute to 1 Month. Plus, the technical analysis page will display three different signals: Summary, Oscillators, and Moving Averages, for different time frames.
As seen on JEPI’s page, in the 1 Day time frame, the Moving Averages give a Strong Sell signal, determined by 12 Bearish signals. On the other hand, Oscillators give a Buy signal for JEPI. This is based on three Bearish, two Neutral, and five Bullish signals.
Meanwhile, the Summary gives an overall Sell signal for JEPI. This is based on the combined effect of both Oscillators and Moving Averages. Thus, the ETF has 15 Bearish signals, two Neutral signals, and five Bullish signals.

Furthermore, below the chart, you can also see the signals generated by the security’s Moving Averages Convergence Divergence (MACD) indicator, 20-Day exponential moving average, and 50-Day exponential moving average. While the MACD gives a Buy signal, both of the exponential moving averages give us a Sell signal.

That’s not all – you can use this Technical Analysis page along with the Chart page to conduct an in-depth study on all the indicators of your choice.
Schwab US Dividend Equity ETF (SCHD)
The Schwab US Dividend Equity ETF aims to closely track the total returns (excluding fees and expenses) of the Dow Jones U.S. Dividend 100 Index. As the name goes, SCHD is an income-generating, index-tracking ETF, with a relatively low expense ratio.
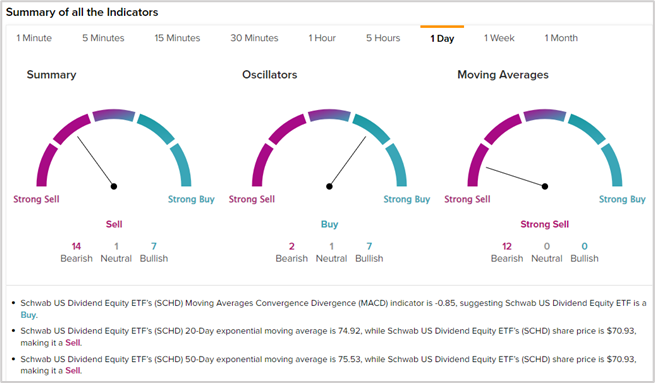
Similar to JEPI, in the 1 Day time frame, SCHD also has a Sell Summary Signal based on 14 Bearish, one Neutral, and seven Bullish signals.
SCHD’s Moving Averages give a Strong Sell Signal based on 12 unanimous Bearish signals. Meanwhile, SCHD’s Oscillators give a Buy signal based on two Bearish, one Neutral, and seven Bullish signals.
Moreover, the MACD gives a Buy signal, while both of the exponential moving averages give us a Sell signal for SCHD.
Ending Thoughts
The introduction of TipRanks’ Technical Analysis page will enable investors to better time their trades. The technical indicators can help us to decide when is a good time to enter or exit a position in a stock/ETF.
As we can see from the live example of JEPI and SCHD above, now is not a good time to buy the two ETFs. And this may be the right advice for any investment security as the markets are fearing the possibility of a recession amid more interest rate hikes. Regular scanning of the technical indicators will tell you when it’s the best time to enter the ETFs.
TipRanks’ Technical Analysis page provides a quick and easy-to-understand overview of the stock’s technical signals, including Moving Averages, Pivot Points, and popular technical indicators, while the advanced charting tool allows users to delve deeper into the stock’s price and volume data. Now, go ahead and try the new page and see just how effectively it helps you make informed investment decisions.