


At TipRanks, we are dedicated to empowering our users with the most comprehensive and accurate stock market information. Our goal is to provide a platform that simplifies the process of navigating the stock market and enables informed investment decisions. To that end, we have added a Technical Analysis tab to our platform, in response to the numerous requests we received from our users. We are proud to provide this new feature, which presents a streamlined and user-friendly way to access technical analysis information.
The Technical Analysis tab provides a quick and easy-to-understand overview of the stock’s technical signals, including Moving Averages, Pivot Points, and popular technical indicators such as RSI and MACD. With this new tab, users can quickly and easily assess the technical health of a stock and make informed investment decisions.
We believe that knowledge is power, and we are committed to providing the best tools and information to our users. TipRanks’ Technical Analysis tab is just one of the many reasons we are the go-to source for alternative stock data and insights.
What is Technical Analysis?
Technical Analysis is a method of evaluating securities by analyzing statistics generated by market activity, such as past prices and volume. This type of analysis is often used by traders and investors to identify trends, predict stock movement, and make informed investment decisions.
We include data about Moving Averages, Pivot Points, and various technical indicators such as RSI (14), STOCH (9,6), MACD (12,26), CCI (14), and Williams %R. All are commonly used tools in technical analysis.
Moving Averages provide insight into the trend of a security by smoothing out its price data and highlighting the overall direction of the trend. For example, a stock’s 50-day moving average shows the average price over the past 50 days, which can help identify a bullish or bearish trend.
Pivot Points, on the other hand, help identify key support and resistance levels by calculating the average of a stock’s high, low, and close prices. These levels can be used to determine when to enter or exit a trade.
The technical indicators mentioned above are mathematical calculations that help traders and investors analyze market conditions and make predictions about future price movements. For example, the Relative Strength Index (RSI) measures whether a security is overbought or oversold, while the Moving Average Convergence Divergence (MACD) indicator helps identify changes in momentum. By providing these tools, the Technical Analysis tab on TipRanks empowers users to make informed decisions and stay ahead of the curve in the stock market.
TipRanks’ Technical Indicators Summary Signals
TipRanks has taken the various technical indicators and aggregated them into three easy-to-read summary signals to provide a comprehensive overview of the stock’s technical health. The first signal summarizes the Moving Averages from MA5 up to MA200, and provides an aggregated signal ranging from Strong Sell to Strong Buy, based on the trend indicated by these averages. This signal is especially useful in determining the overall trend of the stock, as Moving Averages provide a smooth representation of the stock’s price action over a given time period.
The second signal aggregates all the technical indicators, such as RSI, MACD, and CCI, into a single signal that gives users a quick understanding of the stock’s overall technical strength. These technical indicators measure various aspects of market behavior and help traders and investors identify potential trading opportunities.
The third signal brings together the Moving Averages and the Technical Indicators into a single, summarized signal. This unique calculation, created by TipRanks, takes into account the different signals and creates a comprehensive overview of the stock’s technical outlook.
With these three signals, TipRanks users can quickly and easily assess a stock’s technical health and make informed investment decisions, without having to analyze individual indicators and perform complex calculations themselves. Furthermore, TipRanks provides these summary signals for a variety of time frames, ranging from 1 minute to 1 month, and each time period receives its own unique signal, giving users the flexibility to view the technical analysis in a time frame that suits their investment strategy.
Technical Indicators and the Advanced Chart
The new Technical Indicators tab is complementary to TipRanks’ advanced charting tool, providing a more comprehensive view of the stock’s technical outlook.
With the advanced charting tool, users can view the stock’s historical price and volume data in an interactive, graphical format, and apply technical analysis indicators such as Moving Averages to their charts. By combining the advanced charting tool with the Technical Indicators tab, users can get a complete picture of the stock’s technical analysis.
The Technical Indicators tab provides a quick, aggregated overview of the stock’s technical signals, while the advanced charting tool allows users to delve deeper into the stock’s price and volume data and apply their own technical analysis to support their investment decisions.
Baidu Stock Technical Analysis: A Comprehensive View
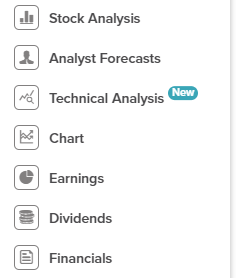
To find the new Technical Analysis tab, simply go to any stock page and it will be located on the left side of the page. Conveniently located under the Analyst Forecast tab and above the Chart tab, accessing the Technical Analysis tab is easy for users. To use the tab, select the stock you want to analyze and click on the Technical Analysis tab.
We have chosen the stock BIDU as an example to showcase the capabilities of our new Technical Analysis tab.
Baidu (BIDU) is a technology company based in China and is often referred to as the “Google of China.” The company announced that its AI chatbot project, named “Ernie bot” in English or “Wenxin Yiyan” in Chinese, is expected to complete internal testing in March before being made public. To analyze the potential impact of this news on BIDU’s stock, we will look at its Technical Analysis on a 1-month time frame.
In this time frame, the Moving Averages signal indicates that the stock is a Strong Buy, with nine bullish signals and only one bearish signal. Meanwhile, the Oscillators are giving a neutral signal, with three bullish signals, five neutral signals, and two bearish signals. Overall, the TipRanks Summary Signal for the 1-month time frame gives a Buy signal. This combination of signals gives a comprehensive view of BIDU’s technical analysis, providing the background for a more informed investment decision.

Conclusion
The addition of the Technical Analysis tab to TipRanks is a significant step forward in providing the most comprehensive and user-friendly platform for alternative stock market information. With this new feature, our users can quickly and easily assess the technical health of a stock, enabling informed investment decisions. The Technical Analysis tab provides a quick and easy-to-understand overview of the stock’s technical signals, including Moving Averages, Pivot Points, and popular technical indicators, while our advanced charting tool allows users to delve deeper into the stock’s price and volume data.
Here at TipRanks, we are dedicated to empowering our users with the best tools and information, and we are confident that the Technical Analysis tab will be a valuable resource for all of our users. Whether you’re a seasoned investor or just starting out, the Technical Analysis tab is a must-have tool for anyone looking to navigate the stock market with confidence.