

Want to see WFCF full AI Analyst Report?
Where Food Comes From (WFCF) Q2 2026 Earnings Report
WFCF Q2 2026 EPS Results
- Actual EPS
- $0.08
- Consensus EPS
- ―
- Beat/Miss
- ―
- One Year Ago EPS
- $0.11
WFCF Q2 2026 Revenue Results
- Actual Revenue
- $6.61M
- Expected Revenue
- ―
- Beat/Miss
- ―
- YoY Revenue Growth
- +0.75%
Earnings Announcement Details
- Quarter
- Q2 2026
- Date
- 08/06/2026
- Time
- Before Open
- Conference Call
- Thursday, August 6, 2026
Where Food Comes From's next earnings date is estimated for November 18, 2026, based on past reporting schedules.
Q2 2026 Earnings Call Audio
Q2 2026 Earnings Slide Deck
Q2 2026 Earnings Call Summary
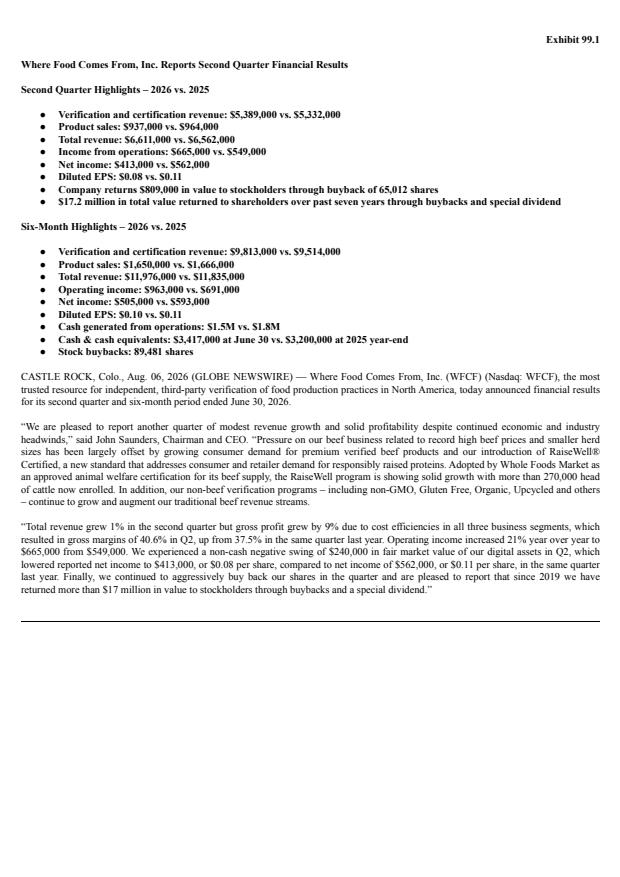
The call conveyed a generally positive operational picture: revenue growth (modest), notable improvements in gross profit, margins and operating income, strong cash generation and continued shareholder returns via buybacks. Management highlighted meaningful product diversification (RaiseWell, CARE, sustainability audits) and renewed strategic flex through a shelf registration for M&A. Offsetting these positives were a notable decline in reported net income driven by noncash digital asset valuation swings and the loss of a prior-year dividend, ongoing headwinds in the core beef business (about 50% of revenue) and limited participation in some high-risk food-safety segments. On balance, the company’s operational momentum, diversification, cash generation and shareholder-return actions outweigh the transitory and structural negatives.
Management did not give formal forward‑looking revenue or EPS guidance on the call; instead they provided strategic guidance and near‑term actions: re‑engaging in M&A after a roughly three‑year pause with a focus on transactions that are immediately or near‑term accretive and filing a shelf registration “in the next day or so” to increase deal flexibility (the stock traded over $20 twice this year), continuing aggressive share repurchases (≈65,000 shares repurchased in Q2 and nearly 89,500 YTD, with >$17.2M returned to shareholders since 2019) funded by strong cash generation ($1.5M cash from operations YTD and $3.4M cash at quarter end), and operational priorities to expand RaiseWell beyond beef (currently >270,000 head enrolled and beef ≈50% of revenue), grow their >50‑standard verification portfolio, and pursue service bundling to drive further revenue and margin improvement (Q2 revenue $6.6M; verification revenue $5.4M vs $5.3M LY; gross profit $2.7M, +9% YoY; gross margin 40.6% vs 37.5% LY; Q2 operating income $665K, +21% YoY; Q2 net income $413K, $0.08/share; 6‑month revenue $12.0M; verification revenue YTD $9.8M; YTD operating income $963K; YTD net income $505K, $0.10/share).
- Revenue and Verification GrowthTotal revenue increased slightly to $6.6M in Q2 2026, driven by verification and certification revenue of $5.4M (versus $5.3M in Q2 2025). Six-month total revenue rose 1% to $12.0M from $11.8M, with verification and certification revenue up 3% to $9.8M from $9.5M.
- Improved Profitability and MarginsGross profit increased 9% year-over-year to $2.7M (from $2.5M), and gross margin expanded to 40.6% from 37.5% (up ~3.1 percentage points). Q2 operating income rose 21% YoY to $665K (from $549K).
- Strong Year-to-Date Operating PerformanceOperating income through the first six months increased to $963K from $691K, a ~39% improvement year-over-year, indicating stronger core operating results despite some noncash items affecting net income.
- Cash Generation and LiquidityThe company generated $1.5M in cash from operations year-to-date and closed Q2 with $3.4M in cash and cash equivalents, up from $3.2M at 2025 year-end (approximately +6.3%).
- Share Repurchases and Capital ReturnContinued aggressive buybacks: ~65,000 shares repurchased in Q2 and nearly 89,500 shares repurchased year-to-date. Since 2019 the company has returned more than $17.2M in value to stockholders.
- Product and Market Diversification — New Programs and PartnershipsExpanded solutions portfolio: CARE Certified and new RaiseWell Certified (Whole Foods adopted RaiseWell for beef; >270,000 head enrolled), expansion plans for other proteins (chicken, turkey, pork, lamb, eggs). New partnerships include Potato Sustainability Alliance audits and USDA certification assistance for biochar producer USAgrichar. Company audits to more than 50 standards across multiple food categories.
- Renewed M&A Focus and Financial FlexibilityAfter a ~3-year pause, management is reengaging on M&A as a growth lever and will file a shelf registration to provide flexibility for opportunistic transactions; historically averaged one acquisition per year over 14 years.
- Food Safety and Traceability CapabilitiesOngoing work on biosecurity and traceability: administration relationship with CattleTrace, on-farm biosecurity audits and secure beef supply plans, and Validus Verifications' leadership in SQF on-farm audits — positioning the company to address industry focus on food safety and traceability.
WFCF Earnings History
| Report Date | Fiscal Quarter | Forecast / EPS | Last Year's EPS | EPS YoY Change | Press Release |
|---|---|---|---|---|---|
| Nov 18, 2026 | 2026 (Q3) | ―- | 0.22 | ― | ― |
| Aug 06, 2026 | 2026 (Q2) | ―0.08 | 0.11 | -22.64% (-0.02) | |
| May 14, 2026 | 2026 (Q1) | ―0.02 | 0.01 | 200.00% (+0.01) | |
| Feb 26, 2026 | 2025 (Q4) | ―-0.04 | 0.18 | -121.98% (-0.22) | |
| Nov 13, 2025 | 2025 (Q3) | ―0.22 | 0.09 | 134.78% (+0.12) | |
| Aug 07, 2025 | 2025 (Q2) | ―0.11 | 0.09 | 16.48% (+0.01) | |
| May 08, 2025 | 2025 (Q1) | ―0.01 | 0.03 | -81.25% (-0.03) | |
| Feb 20, 2025 | 2024 (Q4) | ―0.18 | 0.14 | 30.00% (+0.04) | |
| Nov 12, 2024 | 2024 (Q3) | ―0.09 | 0.13 | -29.23% (-0.04) | |
| Aug 08, 2024 | 2024 (Q2) | ―0.09 | 0.09 | 1.11% (+0.00) |
The table shows recent earnings report dates and whether the forecast was beat or missed. See the change in forecast and EPS from the previous year.