

VerticalScope Holdings (VFORF) Q2 2026 Earnings Report
VFORF Q2 2026 EPS Results
- Actual EPS
- -$0.04
- Consensus EPS
- -$0.07
- Beat/Miss
- Beat by +$0.03
- One Year Ago EPS
- -$0.08
VFORF Q2 2026 Revenue Results
- Actual Revenue
- $13.69M
- Expected Revenue
- $13.61M
- Beat/Miss
- Beat by +$82.94K
- YoY Revenue Growth
- -4.95%
Earnings Announcement Details
- Quarter
- Q2 2026
- Date
- 08/13/2026
- Time
- After Close
- Conference Call
- Thursday, August 13, 2026
VerticalScope Holdings's next earnings date is estimated for November 10, 2026, based on past reporting schedules.
Q2 2026 Earnings Call Audio
No earnings call audio is available for this earnings event.
Q2 2026 Earnings Slide Deck
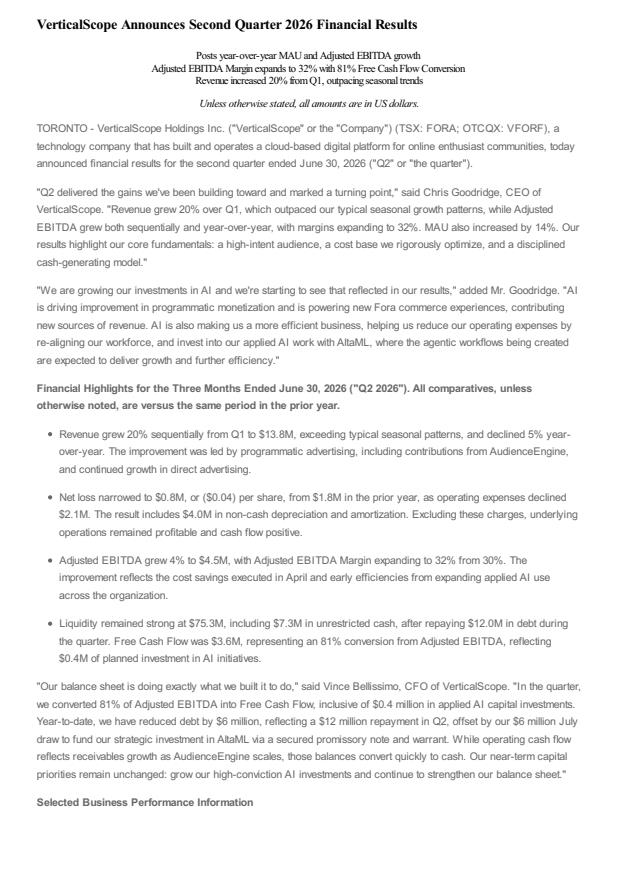
Q2 2026 Earnings Call Summary
The call portrayed a clear operational inflection: sequential revenue recovery, meaningful MAU growth (+14% YoY), a sharp narrowing of programmatic declines (from -34% to -8%), adjusted EBITDA growth and margin expansion, and strong free cash flow conversion — all while investing in AI capabilities (AltaML partnership and capital investments). Offsetting these positives are a 5% YoY revenue decline, ARPU compression (-16% YoY) driven by AudienceEngine mix and presentation effects, commerce weakness due to Ritual, temporary working capital and operating cash flow pressure, and near-term leverage uptick related to the AltaML funding. Overall, management framed Q2 as the 'turn' driven by controllable operational levers and disciplined capital allocation.
Management's guidance focused on profitable, AI‑funded growth: they reiterated a full‑year target of 30%+ adjusted EBITDA margin (Q2 adj. EBITDA $4.5M, up 4% YoY; H1 adj. EBITDA $6.8M at a 27% margin), with margins expected to build from the Q1 trough toward a Q4 peak; free cash flow conversion was 81% in Q2 and 83% through H1, and free cash flow will be directed to AI investments and debt reduction. They plan roughly $2.0M of incremental AI capex in 2026 (≈$400k in Q2; a $1.5M AltaML base fee capitalized through mid‑October plus ~ $300k performance‑based), have $75.3M total liquidity, repaid $12M in the quarter leaving gross debt of ~$32M (subsequently made a $6.1M AltaML loan funded by a $6M revolver draw, bringing revolver outstanding to $38M and moving net leverage from 1.24x to ~1.5x), and expect to work that down to low‑1x net leverage by year‑end. They also signaled improving top‑line momentum (Q2 revenue $13.8M, -5% YoY, +20% sequentially), MAU averaged 103M (+14% YoY), programmatic declines narrowed to -8% YoY (from -34% in Q1), and direct bookings were pacing +7% as of end‑July.
- Monthly Active Users (MAU) GrowthMAU averaged 103 million in Q2, up 14% year-over-year — the company's first YoY MAU growth since the prior search landscape shift, driven mainly by AudienceEngine paid traffic and some direct user growth.
- Sequential Revenue RecoveryTotal revenue was $13.8 million, up 20% sequentially, indicating a strong quarter-over-quarter recovery from Q1 troughs.
- Programmatic Decline NarrowedProgrammatic revenue year-over-year decline improved markedly to -8% in Q2 from -34% in Q1, reflecting better CPMs, impression trends and AudienceEngine ramp.
- Adjusted EBITDA and Margin ExpansionAdjusted EBITDA was $4.5 million, up 4% year-over-year, with adjusted EBITDA margin expanding roughly 270 basis points into the low-30% range (~32%-33%), and first-half adjusted EBITDA of $6.8 million at a 27% margin.
- Strong Free Cash Flow ConversionAdjusted EBITDA converted to free cash flow at a high rate: 81% in Q2 and 83% through the first half, demonstrating durable cash conversion while funding AI investments.
- Cost Discipline and Operating EfficiencyTotal operating expenses declined 13% year-over-year, including wages & consulting down 18% and platform & technology down 14%, supporting margin recovery and funding of AI initiatives.
- AI Strategy and Strategic InvestmentCompany is accelerating AI initiatives (partnering with AltaML), deployed $400k in AI CapEx in Q2, plans ~ $2M incremental AI investment for the year, and made a $6.1M secured debt investment in AltaML to accelerate AI-driven product and workflow improvements.
- Diversifying Commerce MomentumAffiliate commerce on FORA grew 13% year-over-year and is approaching a $1 million annual run rate (2x the previously reported level); e-commerce (excluding Ritual) grew 3% YoY in the quarter.
- Capital Position and Debt Reduction ProgressRepaid $12 million on the revolver during the quarter, ended the quarter with $75.3 million in total liquidity and gross debt of $32 million; net leverage was 1.24x at quarter-end (temporarily ~1.5x after a July draw to fund AltaML) with a target toward low-1x by year-end.
- Commercial Traction in Direct AdvertisingDirect advertising was flat in Q2 and up 3% in the first half; direct bookings as of end of July were pacing 7% ahead of prior year, and the company onboarded two new insurance customers in July.
VFORF Earnings History
| Report Date | Fiscal Quarter | Forecast / EPS | Last Year's EPS | EPS YoY Change | Press Release |
|---|---|---|---|---|---|
| Nov 10, 2026 | 2026 (Q3) | 0.02- | -0.02 | ― | ― |
| Aug 13, 2026 | 2026 (Q2) | -0.07-0.04 | -0.08 | 50.00% (+0.04) | |
| May 12, 2026 | 2026 (Q1) | -0.11-0.14 | -0.11 | -27.27% (-0.03) | |
| Mar 03, 2026 | 2025 (Q4) | 0.01-0.16 | -0.03 | -433.33% (-0.13) | |
| Nov 05, 2025 | 2025 (Q3) | -0.04-0.02 | 0.06 | -133.33% (-0.08) | |
| Aug 13, 2025 | 2025 (Q2) | -0.06-0.08 | 0.02 | -500.00% (-0.10) | |
| May 13, 2025 | 2025 (Q1) | -0.08-0.11 | -0.05 | -120.00% (-0.06) | |
| Mar 12, 2025 | 2024 (Q4) | 0.07-0.03 | 0.1 | -130.00% (-0.13) | |
| Nov 12, 2024 | 2024 (Q3) | 0.030.06 | -0.02 | 400.00% (+0.08) | |
| Aug 07, 2024 | 2024 (Q2) | 0.000.02 | -0.1 | 120.00% (+0.12) |
The table shows recent earnings report dates and whether the forecast was beat or missed. See the change in forecast and EPS from the previous year.