

Topaz Energy Corp (TPZEF) Q2 2026 Earnings Report
TPZEF Q2 2026 EPS Results
- Actual EPS
- $0.21
- Consensus EPS
- $0.21
- Beat/Miss
- Missed by -$0.01
- One Year Ago EPS
- $0.13
TPZEF Q2 2026 Revenue Results
- Actual Revenue
- $78.38M
- Expected Revenue
- $87.19M
- Beat/Miss
- Missed by -$8.81M
- YoY Revenue Growth
- +39.65%
Earnings Announcement Details
- Quarter
- Q2 2026
- Date
- 07/27/2026
- Time
- After Close
- Conference Call
- Monday, July 27, 2026
Topaz Energy Corp's next earnings date is estimated for March 2, 2027, based on past reporting schedules.
Q2 2026 Earnings Call Audio
No earnings call audio is available for this earnings event.
Q2 2026 Earnings Slide Deck
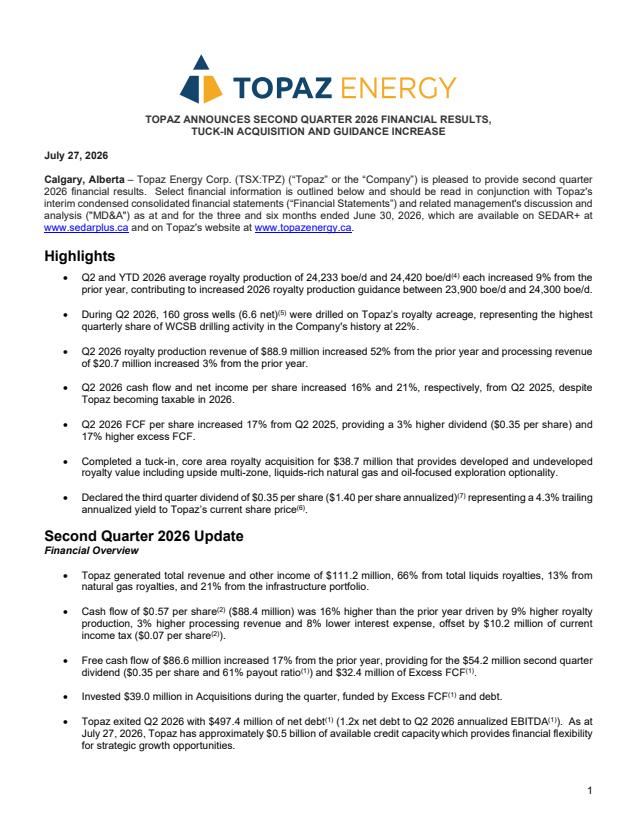
Q2 2026 Earnings Call Summary
The call conveyed a predominantly positive operational and financial story: record liquids production, higher royalty volumes, strong cash flow and free cash flow growth, high infrastructure utilization and margins, a strategic tuck-in acquisition, and an upwardly revised production guide. Management acknowledged some near-term risks — gas seasonality, operator-controlled capital decisions, market volatility and existing leverage — and takes a cautious stance in guidance, but these risks appear manageable relative to the quarter's strong results and strategic progress.
Topaz raised its 2026 annual average royalty production guidance to 23,900–24,300 BOE/d (midpoint 24,100), citing Q2 royalty production of 24,233 BOE/d (+9% y/y) and record liquids royalties of 7,178 bbl/d (+6% y/y); Q2 total revenue and other income was $111.2M, cash flow was $88.4M ($0.57/share, +9% y/y), free cash flow was $86.6M ($0.56/share, +17% y/y) and the company paid $54.2M in dividends ($0.35/share, a 4.5% trailing annualized yield). After a $38.7M acquisition of 300,000 gross acres (over 500 gross future drilling locations) Topaz exited Q2 with $497.4M net debt (~1.2x Q2 annualized EBITDA) and now estimates 2026 exit net debt of $435–440M (pre‑incremental acquisition); management expects 26–31 rigs active across its acreage through Q3, will maintain the payout at the lower end of a 60–90% long‑term target range, and noted infrastructure utilization of 96% with a 92% operating margin and processing revenue of $20.7M ($22.3M total processing revenue & other income).
- Production Growth and Record LiquidsSecond quarter royalty production of 24,233 BOE/day, up 9% year-over-year; record total liquids production of 7,178 barrels/day, up 6% year-over-year.
- Strong Revenue and Cash GenerationTotal Q2 revenue and other income of $111.2 million with cash flow of $88.4 million ($0.57/share), up 9% year-over-year, and free cash flow of $86.6 million ($0.56/share), up 17% year-over-year.
- High-Utilization Infrastructure and MarginInfrastructure assets ran at 96% utilization in the quarter and delivered a 92% operating margin; processing revenue was $20.7 million (up 3% vs Q2 2025) and total processing revenue and other income of $22.3 million.
- Strong Drilling Activity and Basin Share160 gross wells (6.6 net) drilled in Q2 and 126 gross wells brought on production; represented the highest quarterly share of WCSB drilling activity in company history at 22%.
- Portfolio Diversification and Area-Level OutperformanceActivity diversified across Clearwater (78 wells), Northeast BC & Alberta Montney (40), Deep Basin (22) and others; Clearwater and NE BC growth plays captured 69% and 45% of spuds respectively on Topaz royalty lands.
- Strategic Tuck-In AcquisitionCompleted a $38.7 million acquisition of 300,000 gross acres in Northeast BC Montney and Deep Basin, adding royalty interest across >500 gross future drilling locations and multi-zone liquids-rich upside.
- Balance Sheet and Payout DisciplineExited Q2 with net debt of $497.4 million (1.2x net debt to Q2 annualized EBITDA); distributed $54.2 million in dividends ($0.35/share) and allocated $32.4 million of excess free cash flow to the acquisiton; 2026 exit net debt now estimated at $435–$440 million (pre incremental acquisition).
- Upgraded 2026 Production GuidanceAnnual average royalty production guidance increased to 23,900–24,300 BOE/day (company expects to be at the lower end of payout ratio target range to preserve flexibility).
- Operational and Technical ImprovementsOperators adopting improved completion and drilling techniques (e.g., shift from ball drop to plug-and-perf) and capital efficiency gains leading to maintenance capital as a share of cash flow decreasing from ~30% toward ~20% in some areas.
TPZEF Earnings History
| Report Date | Fiscal Quarter | Forecast / EPS | Last Year's EPS | EPS YoY Change | Press Release |
|---|---|---|---|---|---|
| Mar 02, 2027 | 2026 (Q4) | 0.24- | 0.15 | ― | ― |
| Nov 02, 2026 | 2026 (Q3) | 0.210.23 | 0.07 | 220.00% (+0.16) | |
| Jul 27, 2026 | 2026 (Q2) | 0.210.21 | 0.13 | 61.11% (+0.08) | |
| May 05, 2026 | 2026 (Q1) | 0.230.18 | 0.1 | 78.57% (+0.08) | |
| Feb 24, 2026 | 2025 (Q4) | 0.080.15 | 0.09 | 75.00% (+0.06) | |
| Nov 03, 2025 | 2025 (Q3) | 0.040.07 | 0.09 | -16.67% (-0.01) | |
| Jul 28, 2025 | 2025 (Q2) | 0.060.13 | 0.09 | 50.00% (+0.04) | |
| May 05, 2025 | 2025 (Q1) | 0.070.10 | 0.03 | 250.00% (+0.07) | |
| Feb 24, 2025 | 2024 (Q4) | 0.080.09 | 0.09 | -7.69% (-0.01) | |
| Nov 04, 2024 | 2024 (Q3) | 0.050.09 | 0.05 | 71.43% (+0.04) |
The table shows recent earnings report dates and whether the forecast was beat or missed. See the change in forecast and EPS from the previous year.
