

Want to see TAP full AI Analyst Report?
Molson Coors (TAP) Q2 2026 Earnings Report
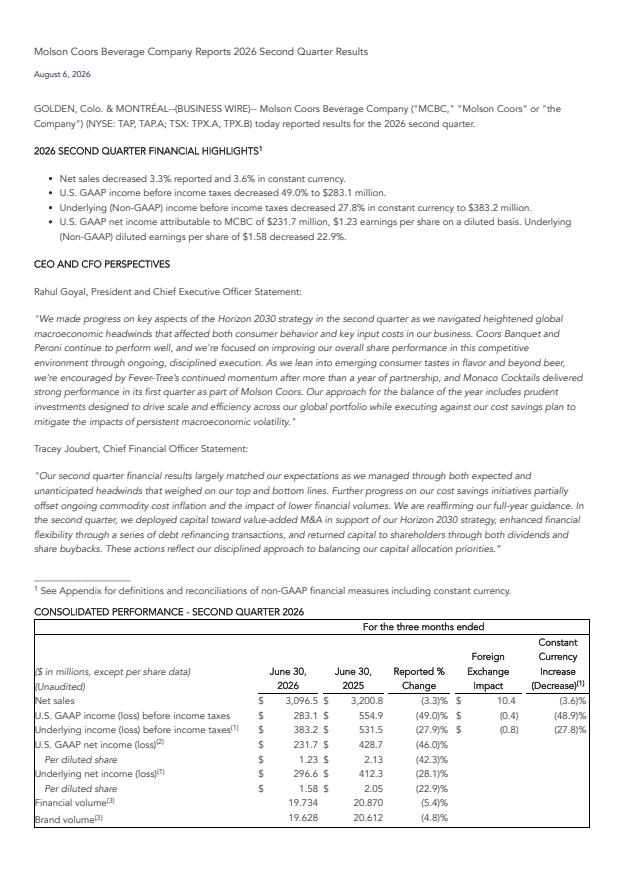
TAP Q2 2026 EPS Results
- Actual EPS
- $1.58
- Consensus EPS
- $1.51
- Beat/Miss
- Beat by +$0.07
- One Year Ago EPS
- $2.05
TAP Q2 2026 Revenue Results
- Actual Revenue
- $3.10B
- Expected Revenue
- $3.08B
- Beat/Miss
- Beat by +$13.38M
- YoY Revenue Growth
- -3.26%
Earnings Announcement Details
- Quarter
- Q2 2026
- Date
- 08/06/2026
- Time
- Before Open
- Conference Call
- Thursday, August 6, 2026
Molson Coors's next earnings date is estimated for November 5, 2026, based on past reporting schedules.
Q2 2026 Earnings Call Audio
Q2 2026 Earnings Slide Deck
Q2 2026 Earnings Call Summary
The call presents a mixed picture: material near-term financial pressures (notably a ~28% decline in underlying pretax income, COGS inflation and volume headwinds) are balanced by strategic progress—portfolio expansion (Monaco, Fever-Tree momentum), targeted brand wins (Peroni, Coors Banquet, Keystone innovations), active cost-savings and supply‑chain investments, and a resilient balance sheet that supports capital deployment. Management reaffirmed guidance and highlighted actions to mitigate inflation and improve commercial execution, but significant margin compression and competitive volatility keep the tone cautious.
Molson Coors reaffirmed its fiscal 2026 guidance while acknowledging Q2 pressure (constant‑currency consolidated net sales down 3.6%, underlying pretax income down 27.8% and underlying EPS down 22.9%) and saying it still expects full‑year U.S. industry volume to be an improvement versus 2025’s ~‑5% (Q1 internal est. ‑1.6%, Q2 ‑4.2%), with U.S. shipments anticipated to slightly outpace brand volumes in H2 and pricing of roughly 1–2% annually; the company now expects Midwest Premium inflation to be in excess of $130M for the year (Q2 impact ~ $40M), sees continued commodity and fuel cost pressure through H2 partially offset by hedges, a 3‑year $450M cost‑savings program and productivity actions, and expects MG&A to decline in H2 versus prior year, while balance‑sheet and capital allocation metrics include net debt/underlying EBITDA of 2.53x (aiming for <2.5x by year‑end), $650M of global CapEx allocations, nine months of NSR/profit from the Monaco acquisition, $90M of dividends paid, 1M shares repurchased for $42M (15.3% of Class B repurchased since Oct‑2023) and $2.35B of buyback authorization remaining.
- Reaffirmed Fiscal 2026 GuidanceManagement reaffirmed full-year 2026 guidance, signaling confidence in available levers (pricing, mix, cost savings, portfolio actions) despite near-term volatility.
- Top-line and Brand Wins (Selected)Notable brand performance: Peroni grew U.S. brand volumes by double digits; Coors Banquet grew share and brand volume; Keystone Light Apple (Kapple) generated strong demand and will be relaunched in the fall; Fever-Tree delivered its highest U.S. sales quarter since partnership began.
- M&A and Portfolio Expansion SuccessFirst full quarter of ownership of Atomic Brands/Monaco tracked slightly ahead of acquisition expectations on top and bottom line; Monaco, Topo Chico Hard and Fever-Tree each expected to contribute ~1-2% to NSR, supporting Horizon 2030 portfolio transformation.
- Balance Sheet and Capital Allocation StrengthNet debt to underlying EBITDA improved to 2.53x at quarter end (close to year-end target of <2.5x); paid $90M in dividends and repurchased 1M shares for $42M (15.3% of Class B shares repurchased since Oct 2023) with $2.35B remaining repurchase authorization.
- Progress on Cost Savings and ProductivityAdvancing a 3-year $450M cost savings program and executing restructuring actions in EMEA/APAC (including a small UK brewery closure), intended to offset inflationary pressures and improve efficiency.
- Targeted CapEx to Strengthen Supply ChainAllocated portion of $650M global CapEx to modernize and expand supply chain (upgrades at Rocky Mountain Metal Company can plant, new bulk receiving facilities, new/upgraded canning lines) to address aluminum sourcing and create efficiencies.
- Pricing and Mix ActionsCompany expects a U.S. annual price increase of 1-2% (in line with Q2) and anticipates mix benefits from premiumization across business units.
- Execution in Key Occasions and ChannelsStrong on-premise World Cup execution in host cities, targeted local activations (e.g., Dutton Ranch partnership, Restock the Scots Miller Lite barge), and retail spring resets that secured incremental shelf and cooler space for core brands.
TAP Earnings History
| Report Date | Fiscal Quarter | Forecast / EPS | Last Year's EPS | EPS YoY Change | Press Release |
|---|---|---|---|---|---|
| Nov 05, 2026 | 2026 (Q3) | 1.45- | 1.67 | ― | ― |
| Aug 06, 2026 | 2026 (Q2) | 1.511.58 | 2.05 | -22.93% (-0.47) | |
| Apr 30, 2026 | 2026 (Q1) | 0.360.62 | 0.5 | 24.00% (+0.12) | |
| Feb 18, 2026 | 2025 (Q4) | 1.151.21 | 1.3 | -6.92% (-0.09) | |
| Nov 04, 2025 | 2025 (Q3) | 1.701.67 | 1.8 | -7.22% (-0.13) | |
| Aug 05, 2025 | 2025 (Q2) | 1.822.05 | 1.92 | 6.77% (+0.13) | |
| May 08, 2025 | 2025 (Q1) | 0.780.50 | 0.95 | -47.37% (-0.45) | |
| Feb 13, 2025 | 2024 (Q4) | 1.131.30 | 1.19 | 9.24% (+0.11) | |
| Nov 07, 2024 | 2024 (Q3) | 1.671.80 | 1.92 | -6.25% (-0.12) | |
| Aug 06, 2024 | 2024 (Q2) | 1.701.92 | 1.78 | 7.87% (+0.14) |
The table shows recent earnings report dates and whether the forecast was beat or missed. See the change in forecast and EPS from the previous year.