

Scentre Group (STGPF) Q2 2026 Earnings Report
STGPF Q2 2026 EPS Results
- Actual EPS
- $0.13
- Consensus EPS
- $0.08
- Beat/Miss
- Beat by +$0.05
- One Year Ago EPS
- $0.11
STGPF Q2 2026 Revenue Results
- Actual Revenue
- $864.05M
- Expected Revenue
- ―
- Beat/Miss
- ―
- YoY Revenue Growth
- -8.35%
Earnings Announcement Details
- Quarter
- Q2 2026
- Date
- 08/24/2026
- Time
- After Close
- Conference Call
- Monday, August 24, 2026
Scentre Group's next earnings date is estimated for February 24, 2027, based on past reporting schedules.
Q2 2026 Earnings Call Audio
Q2 2026 Earnings Slide Deck
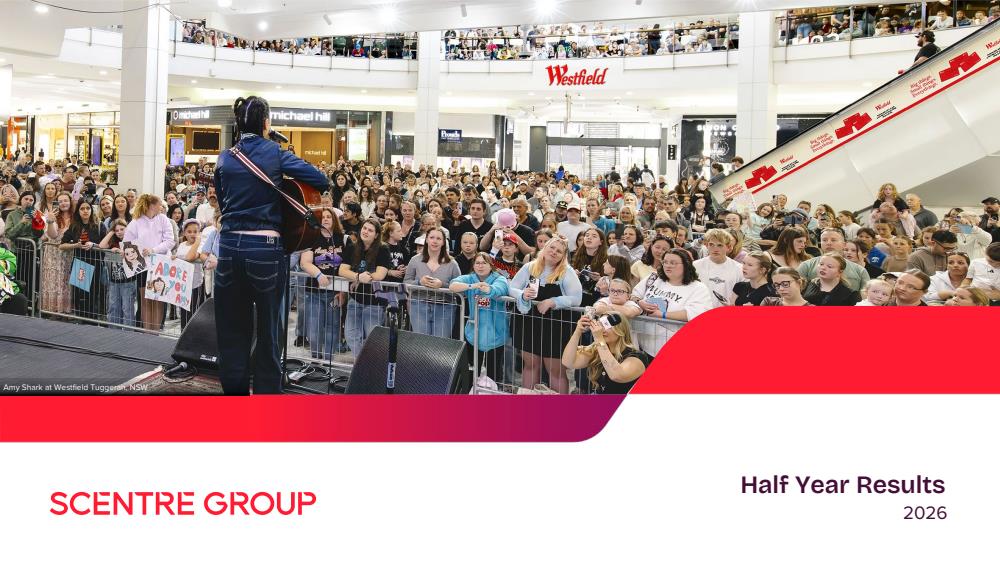
Q2 2026 Earnings Call Summary
The call presents a broadly positive operating and capital-management story: record visitation and business partner sales, very high occupancy (99.8%), robust leasing metrics (5.5% rent escalations, 3.7% re-leasing spreads), successful refinancing and improved funding margins, a growing residential pipeline, and an upgraded FY guidance. Offsetting items are largely execution/timing risks (planning approvals, ACCC sign-off on a JV), some margin pressure from higher property costs and one-off development cash flow timing, and the need to monitor the relationship between cap rates and rising cost of capital. On balance the operational momentum, balance-sheet improvements and guidance upgrade outweigh the challenges.
Scentre upgraded FY26 guidance, advising H2 FFO of at least $0.126 per security (H2 growth ≥4.5%) which implies full‑year FFO of at least $0.2379 per security (FY growth ≥4.25%), and H2 distributions of $0.09258 per security implying FY distributions of $0.18473 per security (growth 4.25%); this is backed by H1 FFO of $612m (+4.4%), H1 distributions of $0.09215 (+4.5%), strong operating momentum — 347m visits in H1 (+3.5%), record LTM visits 552m, LTM business partner sales $30.3bn (+4.2% YoY; +$1.0bn YoY and +$7.4bn vs 2022), specialty sales LTM +5.4% (H1 +5.1%, recent 3 months +4.7%, July +3.6%), occupancy 99.8%, average specialty rent escalations 5.5%, 1,401 leases completed with +3.7% re‑leasing spreads — and supported by balance‑sheet actions (refinanced $4.1bn high‑cost debt, $750m 6‑yr senior note at +1.2% margin, renegotiated $1.7bn facilities, WAC margin down from 2.6% to 1.6%, weighted average interest ~5.4% vs 5.7% prior, $3.5bn liquidity, $10.1bn swaps executed and hedge coverage 95% at avg base 3.26% for June 2026).
- Funds from Operations and Distribution GrowthFFO for H1 2026 was $612 million, up 4.4% year-over-year. Distributions were $0.09215 per security for the half, up 4.5%.
- Upgraded Full-Year GuidanceManagement upgraded H2 FFO guidance to at least $0.126 per security (H2 growth of at least 4.5%), implying full-year FFO of at least $0.2379 per security (full-year growth of at least 4.25%). H2 distribution guidance was upgraded to $0.09258, implying a full-year distribution of $0.18473 (growth of 4.25%).
- Record Customer Visits and Strong Visitation GrowthAnnual customer visits reached a record 552 million (up from 408 million in 2022; +144 million). H1 2026 saw 347 million visits, +12 million versus prior year (+3.5%). Average weekly visits exceed 10.5 million across 42 destinations.
- Record Business Partner Sales and Specialty Sales StrengthBusiness partner sales reached a record $30.3 billion for the 12 months to 30 June 2026, up $1.0 billion (+4.2%) year-over-year. Specialty sales grew 5.4% over 12 months, 5.1% in H1, 4.7% over the most recent 3 months and 3.6% in July.
- Occupancy, Leasing Activity and Rent EscalationsPortfolio occupancy at 99.8% (highest June level in over a decade). Completed 1,401 leasing deals with average positive re-leasing spreads of 3.7%. Average specialty rent escalations of 5.5% in the six months.
- Capital Recycling and Joint Venture FundingSince 2022 introduced $3.1 billion of new joint venture capital into assets while retaining management and exposure. Announced divestment of 50% interest in Westfield Mt Gravatt for $882.5 million (cap rate 5.5%, 3.5% premium to book).
- Balance Sheet and Funding ImprovementsRefinanced $4.1 billion of high-cost borrowings, issued a $750 million 6-year senior note at a 1.2% margin, and extended $1.7 billion of bank facilities at lower margins. Weighted average credit margin improved from 2.6% (31 Dec 2025) to 1.6% (30 Jun 2026). Weighted average interest rate reduced from 5.7% (H1 2025) to 5.4% (H1 2026). Available liquidity $3.5 billion.
- Hedging and Interest Rate ManagementYear-to-date executed $10.1 billion of interest rate swaps. Hedge coverage at June 2026 was 95% at an average base rate of 3.26% (and 89% at Dec 2026 at 3.29%).
- Investment and Development PipelineInvested more than $1 billion across destinations since 2022 with 12 significant projects completed or underway. Pipeline of potential residential dwellings approved or in advanced planning expanded from 20,200 to 25,600. Target redevelopment yields 6%-7% with incremental total returns targeted at 12%-15%.
- Trading Performance and Brand EngagementEarnings per security are more than 15% higher than year to June 2023. Westfield membership exceeds 5.2 million. Successful community/brand initiatives included SBS fan zones (218,000 visits during FIFA) and new partnerships (NFL, Disney), and new customer engagement product launching (Westfield World of Wins).
- Statutory Profit and ValuationsStatutory profit of $975 million for the half, including an unrealized property revaluation uplift of $478 million. Overall property valuations rose 1.6% during the period; weighted average capitalization rate broadly unchanged at 5.45% (June 2026).
STGPF Earnings History
| Report Date | Fiscal Quarter | Forecast / EPS | Last Year's EPS | EPS YoY Change | Press Release |
|---|---|---|---|---|---|
| Feb 24, 2027 | 2026 (Q4) | 0.09- | 0.09 | ― | ― |
| Aug 24, 2026 | 2026 (Q2) | 0.080.13 | 0.11 | 24.00% (+0.03) | |
| Feb 23, 2026 | 2025 (Q4) | 0.080.09 | 0.07 | 20.00% (+0.01) | |
| Aug 25, 2025 | 2025 (Q2) | 0.080.11 | 0.06 | 92.31% (+0.05) | |
| Feb 25, 2025 | 2024 (Q4) | 0.080.07 | 0 | 1900.00% (+0.07) | |
| Aug 20, 2024 | 2024 (Q2) | 0.070.06 | 0.07 | -20.41% (-0.01) | |
| Feb 20, 2024 | 2023 (Q4) | 0.070.00 | -0.03 | 114.29% (+0.03) | |
| Aug 21, 2023 | 2023 (Q2) | 0.070.07 | 0.07 | -5.77% (-0.00) | |
| Feb 21, 2023 | 2022 (Q4) | 0.06-0.03 | 0.05 | -147.30% (-0.08) | |
| Aug 22, 2022 | 2022 (Q2) | 0.090.07 | 0.06 | 16.85% (+0.01) |
The table shows recent earnings report dates and whether the forecast was beat or missed. See the change in forecast and EPS from the previous year.
