


City Developments earnings date
Want to see SG:C09 full AI Analyst Report?
City Developments (C09) Q2 2026 Earnings Report
SG:C09 Q2 2026 EPS Results
- Actual EPS
- SGD 0.33
- Consensus EPS
- SGD 0.27
- Beat/Miss
- Beat by +SGD 0.06
- One Year Ago EPS
- SGD 0.10
SG:C09 Q2 2026 Revenue Results
- Actual Revenue
- SGD 2.73B
- Expected Revenue
- SGD 1.97B
- Beat/Miss
- Beat by +SGD 756.57M
- YoY Revenue Growth
- +60.86%
Earnings Announcement Details
- Quarter
- Q2 2026
- Date
- 08/12/2026
- Time
- After Close
- Conference Call
- Wednesday, August 12, 2026
City Developments's next earnings date is estimated for February 25, 2027, based on past reporting schedules.
Q2 2026 Earnings Call Audio
Q2 2026 Earnings Slide Deck
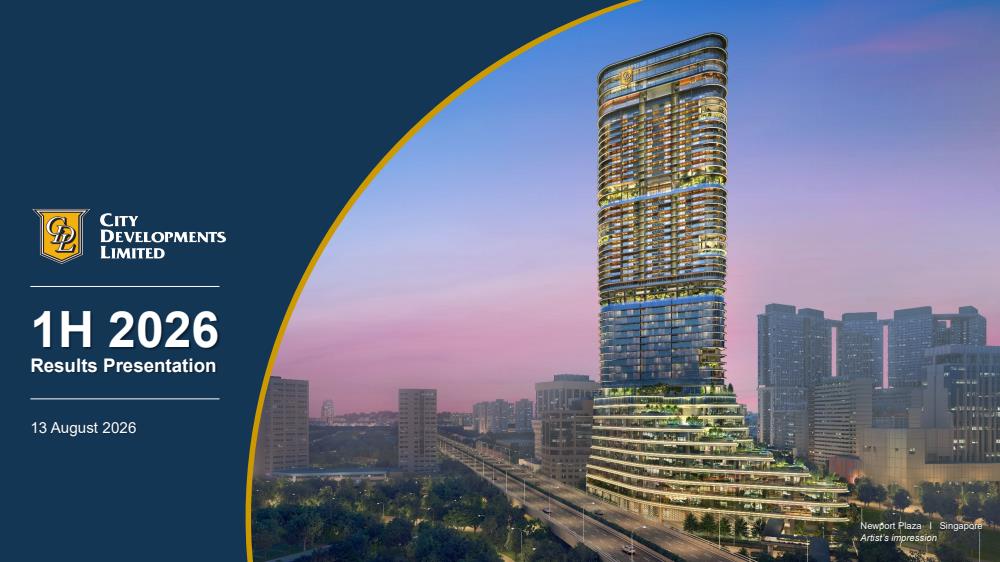
Q2 2026 Earnings Call Summary
The call conveyed a clearly positive operational and financial performance for H1 2026: material revenue growth (+61%), EBITDA (+26%), and PATMI (c.3x) improvements driven by Singapore property development and a hotel turnaround. Management emphasized strong liquidity (SGD 2.0bn cash, SGD 4.9bn committed facilities), active land replenishment and a forthcoming strategic review to address capital recycling and gearing. The principal negatives were a slower-than-expected pace of divestments (reducing capital recycling gains), elevated gearing (75%), and softer pockets in the living and some Asian hotel markets. On balance, the company appears operationally strong with clear plans to address balance-sheet and portfolio optimization risks.
Management guided that H1 was strong: group revenue S$2.7bn (+61% YoY), EBITDA S$694m (+25.9%), PBT S$404m (+189%) and PATMI S$302m (+230% / >3x), driven by property development (revenue +167%; 57% of group revenue but 84% of PBT); hotel revenue +6.4% with RevPAR +4% (Singapore), +10% (US) and +14% (Australasia), hotel EBITDA +27% and GOP ~30% (SG 35%, London 42%, Australasia 35%); investment properties revenue +3.2%. Balance sheet and capital metrics: cash S$2.0bn, committed undrawn facilities S$4.9bn, gearing 75% (up 4ppt since 31 Dec 2025), average interest ~3.4% (management target ≤3.5% by year‑end), net finance costs S$145m (−47%), exchange gain S$38m (vs loss S$63m prior) and IP depreciation ~S$68m. Operational and pipeline metrics: Lumina Grand TOP (Apr), Norwood Grand 92% sold/TOP (Aug), Newport Residences >80% sold, launch pipeline ~2,200 units, two GLS wins (Tanjong Rhu, Peck Hay), upcoming TOPs Myst and CanningHill Piers, office NLA additions of ~220,000 sq ft (Newport Tower H2 next year) and ~250,000 sq ft (Union Square 2029), IP capex ~S$144m this year and remaining redevelopment commitments sub‑S$400m, HIK occupancy 96% and PBSA yield‑on‑cost ~4%. Management reiterated a minimum dividend payout ratio of 35% (interim S$0.06, double prior H1), said capital recycling will be weighted to H2, and confirmed the Board has approved a strategic review to be unveiled end‑September.
- Strong Revenue GrowthGroup revenue for H1 2026 was SGD 2.7 billion, up from SGD 1.7 billion in H1 2025 — an increase of c.61%, driven primarily by Singapore property development and faster recognition from projects that reached completion.
- Material Profitability Improvement (PBT / PATMI)Profit before tax rose to SGD 404 million (improving c.189% year-on-year). PATMI was SGD 302 million — roughly triple year-on-year (management cited ~230% uplift), reflecting strong margin capture from completed development projects.
- EBITDA and Cash Generation MomentumEBITDA increased to SGD 694 million, up c.26% year-on-year. Management reiterated an annual EBITDA target of SGD 1 billion and highlighted robust cash generation from recent and near-term project TOPs.
- Property Development OutperformanceProperty development revenue surged c.167% and this segment accounted for 57% of group revenue but c.84% of PBT, underpinned by completions (e.g., Lumina Grand TOP in April, Norwood Grand TOP in August) and strong sales (Newport >80% sold).
- Hotels: Turnaround and RevPAR GrowthHotel revenue rose 6.4% with RevPAR up 4.9% overall (Singapore +4%, U.S. +10%, Australasia +14%). Hotel operations swung from a loss of SGD 84 million in H1 2025 to a profit of SGD 42 million in H1 2026, supported by the HIK acquisition (occupancy 96%) and cost discipline; hotel EBITDA grew c.27%.
- Resilient Investment Properties and Living PortfolioInvestment property revenue increased c.3.2% despite prior-year divestments; living sector (notably Singapore and some U.K. PRS/Japan PRS) provided resilient contributions and helped offset divestment-related headwinds.
- Strong Liquidity and Funding ProfileGroup reported SGD 2.0 billion cash and SGD 4.9 billion of committed undrawn credit facilities. Average interest cost was c.3.4% (management target to keep <=3.5% by year-end). Total assets ticked up to c. SGD 36 billion (from SGD 35 billion).
- Shareholder Returns and Capital DeploymentInterim dividend declared at SGD 0.06 (double last year's half-year amount). Management reaffirmed a minimum dividend payout policy of 35% and continues disciplined land replenishment (two GLS wins in 2026) and project pipeline (~2,200 units).
SG:C09 Earnings History
| Report Date | Fiscal Quarter | Forecast / EPS | Last Year's EPS | EPS YoY Change | Press Release |
|---|---|---|---|---|---|
| Feb 25, 2027 | 2026 (Q4) | 0.25- | 0.6 | ― | ― |
| Aug 12, 2026 | 2026 (Q2) | 0.270.33 | 0.1 | 236.08% (+0.23) | |
| Feb 27, 2026 | 2025 (Q4) | 0.260.60 | 0.12 | 394.21% (+0.48) | |
| Nov 17, 2025 | 2025 (Q3) | ―- | 0.09 | ― | |
| Aug 12, 2025 | 2025 (Q2) | 0.170.10 | 0.09 | 5.43% (+0.01) | |
| Feb 24, 2025 | 2024 (Q4) | 0.200.12 | 0.26 | -54.17% (-0.14) | |
| Nov 12, 2024 | 2024 (Q3) | ―- | 0.07 | ― | |
| Aug 13, 2024 | 2024 (Q2) | 0.170.09 | 0.07 | 39.39% (+0.03) | |
| Feb 27, 2024 | 2023 (Q4) | 0.330.26 | 0.17 | 51.72% (+0.09) | |
| Nov 08, 2023 | 2023 (Q3) | ―- | 1.18 | ― |
The table shows recent earnings report dates and whether the forecast was beat or missed. See the change in forecast and EPS from the previous year.
