


Perrigo Company earnings date
Want to see PRGO full AI Analyst Report?
Perrigo Company (PRGO) Q3 2026 Earnings Report
PRGO Q3 2026 EPS Results
- Actual EPS
- $0.60
- Consensus EPS
- $0.51
- Beat/Miss
- Beat by +$0.09
- One Year Ago EPS
- $0.80
PRGO Q3 2026 Revenue Results
- Actual Revenue
- $988.60M
- Expected Revenue
- $984.80M
- Beat/Miss
- Beat by +$3.80M
- YoY Revenue Growth
- -5.22%
Earnings Announcement Details
- Quarter
- Q3 2026
- Date
- 11/04/2026
- Time
- Before Open
- Conference Call
- Wednesday, November 4, 2026
Perrigo Company's next earnings date is estimated for March 1, 2027, based on past reporting schedules.
Q3 2026 Earnings Call Audio
Q3 2026 Earnings Slide Deck
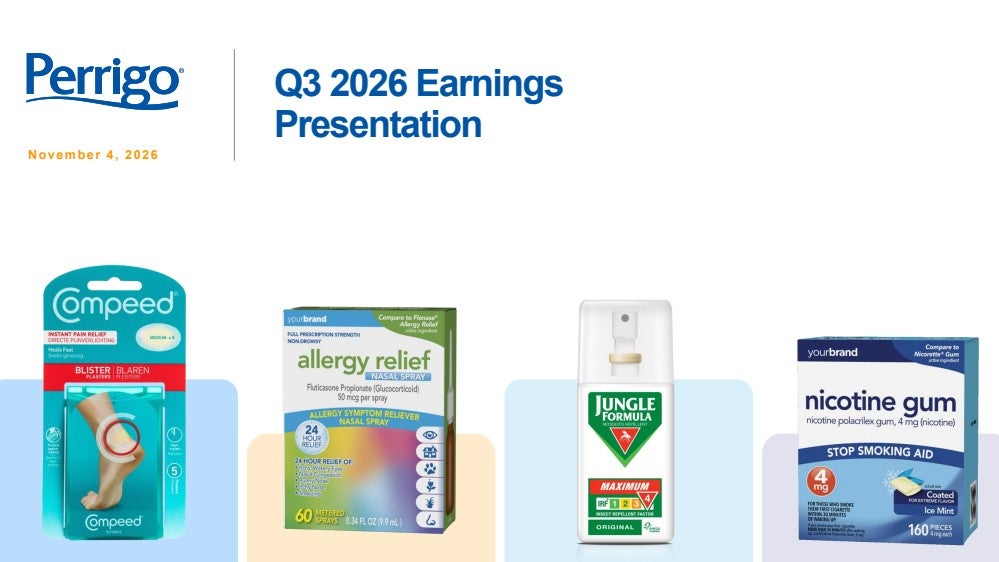
Q3 2026 Earnings Call Summary
The call presented a mixed but improving picture. Perrigo reported sequential improvement in core sales trends and operating margins, meaningful share gains in U.S. store brand OTC and European brands, progress on its Three-S plan, cost savings and a strategically important infant formula divestiture. However, Q3 sales, margins and EPS declined, the company lowered its outlook because of cautious retailer inventory positioning and continued European softness, and leverage remains elevated. The positive strategic and operational developments were offset by significant current-period financial pressures.
For 2026, core reported net sales are expected to decline 2.5%-3.6%, organic net sales to decline 2.7%-3.8%, adjusted gross margin to be 37.5%-38.5%, adjusted operating margin to be 14%-15%, and adjusted diluted earnings per share to be $2.15-$2.35; all-in, which now excludes infant formula but includes other divestitures, reported net sales are expected to decline 4.6%-5.7%, adjusted gross margin to be 37.8%-38.8%, adjusted operating margin to be 14.3%-15.3%, and adjusted diluted earnings per share expected to be between $2.25 and $2.45. For both core and all-in, net interest expense is assumed to be approximately $162 million, adjusted effective tax rate approximately 14%, and approximately 140 million diluted shares outstanding, with year-end net leverage of approximately four times adjusted EBITDA and all-in cash from operating activities as a percentage of adjusted net income expected to be in the low to mid-60% range; the Operational Enhancement Program remains on track to deliver approximately $60 million-$80 million in 2026.
- Sequential Improvement in Core PerformanceCore net sales year-over-year decline moderated from 8.3% in Q1 to 3.1% in Q2 and 1.7% in Q3. Core adjusted operating margin improved sequentially from 12.8% to 13.4% to 14.3%.
- Three-S Plan ProgressManagement said the stabilize, streamline and strengthen plan is working, with improved operating performance, more consistent operations, better service levels and clearer choices about where Perrigo should compete.
- Infant Formula Divestiture Simplifies the PortfolioPerrigo announced an agreement to divest its infant formula business. Management said the transaction simplifies the portfolio and operations, improves the margin profile, reduces expected future capital expenditures and enables greater focus on the core business.
- Operational Enhancement Program SavingsThe Operational Enhancement Program generated $42 million of savings year-to-date and remains on track to deliver approximately $60 million-$80 million in 2026. The program contributed $19 million of benefits in Q3.
- U.S. Store Brand OTC Share GainsU.S. store brand OTC volume grew 2% in Q3, and Perrigo gained 30 basis points of share.
- European Brand Share GainsValue sales in Perrigo's key European brands grew 6.5%, well ahead of their categories, and gained 80 basis points of share.
- Improving Category TrendsU.S. category volume returned to modest growth in Q3. In Europe, consumer trends remained soft, but the rate of decline improved sequentially.
- Growth in Selected Brands and CategoriesCompeed, Opill, ellaOne and Jungle Formula all delivered growth and gained share. Women's health performed well, led by share gains and momentum in ellaOne, along with continued growth from Opill. Store brand nicotine replacement and digestive health also gained share.
- E-Commerce ExpansionU.S. e-commerce total category volume increased nearly 15% year-to-date. E-commerce represented 22% of Perrigo's U.S. volume, up from approximately 13% in 2022, and management said Perrigo's e-commerce share is higher than its share of the total market.
- Innovation and Demand Generation InitiativesPerrigo is directing innovation toward categories where it has a right to win, expanding distribution and investing behind brands, products and customer programs. Its GLP-1 activation positions the digestive health portfolio to support consumers and deepen customer relationships.
- Improved Customer Service and CollaborationManagement said operations are becoming more consistent and service is improving, strengthening relationships and increasing collaboration with retail customers. Key retailers were reported to have service levels of 95 and above.
- Cash Flow and Shareholder ReturnsQ3 cash from operating activities was $96 million, in line with expectations. Capital expenditures totaled $18 million, and Perrigo returned $40 million to shareholders through dividends.
- Reduced Future Capital RequirementsManagement said the infant formula divestiture removes uncertainty because the business was consuming cash in 2026 and will result in a significant reduction in capital requirements going forward, allowing investment to shift toward the core OTC business.
- Updated Outlook Excludes Infant FormulaFor 2026, core reported net sales are expected to decline 2.5%-3.6%, with organic net sales declining 2.7%-3.8%; adjusted gross margin is expected at 37.5%-38.5%, adjusted operating margin at 14%-15%, and adjusted diluted EPS at $2.15-$2.35. All-in adjusted diluted EPS is expected at $2.25-$2.45, with adjusted gross margin of 37.8%-38.8% and adjusted operating margin of 14.3%-15.3%.
- Expected Balance Sheet FocusNet proceeds from the infant formula divestiture are expected to support sustainable business growth, debt reduction and lower net leverage. Year-end net leverage is expected to be approximately four times adjusted EBITDA.
PRGO Earnings History
| Report Date | Fiscal Quarter | Forecast / EPS | Last Year's EPS | EPS YoY Change | Press Release |
|---|---|---|---|---|---|
| Mar 01, 2027 | 2026 (Q4) | 0.82- | 0.77 | ― | ― |
| Nov 04, 2026 | 2026 (Q3) | 0.510.60 | 0.8 | -25.00% (-0.20) | |
| Aug 05, 2026 | 2026 (Q2) | 0.390.50 | 0.57 | -12.28% (-0.07) | |
| May 06, 2026 | 2026 (Q1) | 0.310.43 | 0.6 | -28.33% (-0.17) | |
| Feb 26, 2026 | 2025 (Q4) | 0.780.77 | 0.93 | -17.20% (-0.16) | |
| Nov 05, 2025 | 2025 (Q3) | 0.750.80 | 0.81 | -1.23% (-0.01) | |
| Aug 06, 2025 | 2025 (Q2) | 0.590.57 | 0.53 | 7.55% (+0.04) | |
| May 07, 2025 | 2025 (Q1) | 0.570.60 | 0.29 | 106.90% (+0.31) | |
| Feb 27, 2025 | 2024 (Q4) | 0.920.93 | 0.86 | 8.14% (+0.07) | |
| Nov 06, 2024 | 2024 (Q3) | 0.810.81 | 0.64 | 26.56% (+0.17) |
The table shows recent earnings report dates and whether the forecast was beat or missed. See the change in forecast and EPS from the previous year.
