

Premium Brands (PRBZF) Q2 2026 Earnings Report
PRBZF Q2 2026 EPS Results
- Actual EPS
- $1.09
- Consensus EPS
- $1.10
- Beat/Miss
- Missed by -$0.01
- One Year Ago EPS
- $0.95
PRBZF Q2 2026 Revenue Results
- Actual Revenue
- $1.70B
- Expected Revenue
- $1.70B
- Beat/Miss
- Missed by -$1.65M
- YoY Revenue Growth
- +24.06%
Earnings Announcement Details
- Quarter
- Q2 2026
- Date
- 08/06/2026
- Time
- Before Open
- Conference Call
- Thursday, August 6, 2026
Premium Brands's next earnings date is estimated for November 5, 2026, based on past reporting schedules.
Q2 2026 Earnings Call Audio
No earnings call audio is available for this earnings event.
Q2 2026 Earnings Slide Deck
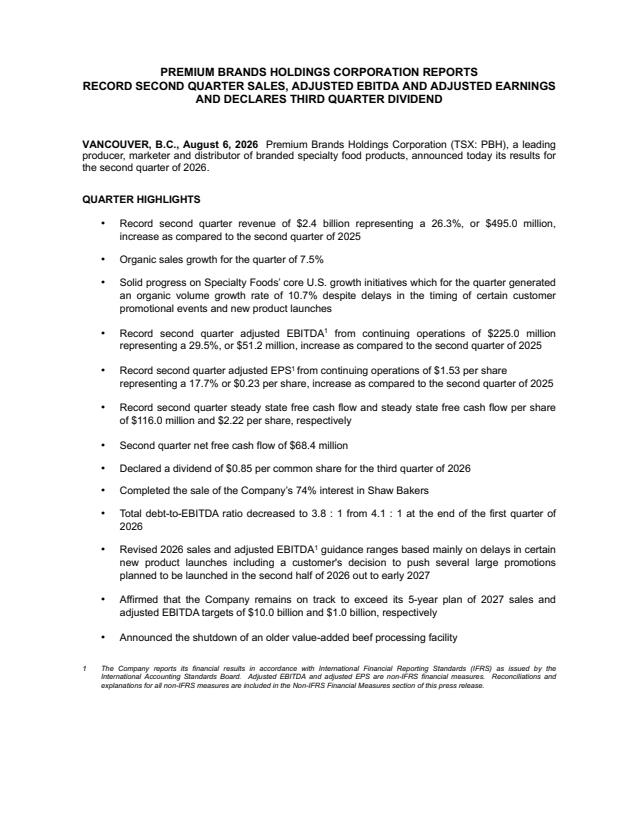
Q2 2026 Earnings Call Summary
The call conveyed a broadly positive operational and financial inflection: strong top-line growth (+26.3%), robust organic volume expansion (10.7% specialty, 25% U.S. protein), an 83.2% surge in meat sticks, materially higher adjusted EBITDA (+29.5%), and the first positive net free cash flow ($68M) after years of negative cash flow. These gains are tempered by near-term headwinds — guidance revisions, timing delays for launches and promotions, a $53.1M shutdown loss and ongoing costs tied to new capacity — but management presented a clear path to leverage new capacity, improve margins, and reduce leverage, supporting an overall constructive outlook.
Management guided 2026 revenue of $9.1–$9.3 billion and adjusted EBITDA of $840–$870 million, reaffirmed its five‑year targets of $10 billion in sales and $1 billion of EBITDA by end‑2027, and said it expects strong back‑half growth; supporting metrics from the quarter include record Q2 sales of $2.4 billion (+26.3%), Q2 adjusted EBITDA of $225 million, Q2 net free cash flow of $68 million (first positive after four years), organic volume growth of 10.7% for Specialty U.S. (25% in U.S. protein) and meat sticks growth of 83.2%; balance‑sheet and CapEx metrics: debt/EBITDA down to 3.8:1 (from 4.3:1), short‑term targets reached (senior debt ≤3:1 and total debt ≤4:1) with a goal of total debt/EBITDA ≤3:1 by early–mid‑2027, Q2 CapEx $59 million (project CapEx $18.3M of the $1.1B plan + $21.6M other project + $19.1M maintenance), $41.6 million remaining to complete the $1.1B plan, and plans to close 4 older facilities and commission 2 new plants in the next 12 months while startup/restructuring costs continue to decline.
- Record Quarterly RevenueTotal sales from continuing operations of $2.4 billion for the quarter, up $495 million or 26.3% vs. Q2 2025.
- Specialty Foods U.S. Sales ExpansionSpecialty Foods total U.S. sales grew by $432.2 million to $1.2 billion, representing 71.2% of Q2 sales (vs. 63.5% in Q2 2025).
- Strong Organic Volume GrowthSpecialty Food Group U.S. growth initiatives delivered 10.7% organic volume growth for the quarter; U.S. Protein initiatives delivered ~25% organic volume growth.
- Outstanding Meat Stick PerformanceMeat stick business grew 83.2% in the quarter; launched a premium Italia meat stick line (new SKU/innovation at Yorkton facility).
- Improved Profitability (Adjusted EBITDA and EPS)Adjusted EBITDA of $225 million, up $51.2 million or 29.5% vs. prior year. Adjusted earnings $79.6 million (+37.2%) and adjusted EPS $1.53 (+17.7%).
- Positive Net Free Cash Flow InflectionGenerated $68 million in net free cash flow in the quarter — the first positive net free cash flow after four years of negative results, with expectations of acceleration in H2 2026.
- Balance Sheet and Capital Efficiency ProgressDebt-to-EBITDA improved to 3.8:1 from 4.3:1 at end of 2025; management targeting total debt-to-EBITDA of 3:1 by early to mid-2027. Only $41.6 million left to spend to complete the $1.1 billion investment plan (which created >$2 billion of new sales capacity).
- Declining Startup/Restructuring Costs and CapEx NormalizationStartup and restructuring costs dropped dramatically as capacity reaches base operating parameters; quarterly CapEx of $59 million with project CapEx peaking in 2023-24 and trending down.
PRBZF Earnings History
| Report Date | Fiscal Quarter | Forecast / EPS | Last Year's EPS | EPS YoY Change | Press Release |
|---|---|---|---|---|---|
| Nov 05, 2026 | 2026 (Q3) | 1.08- | 0.91 | ― | ― |
| Aug 06, 2026 | 2026 (Q2) | 1.101.09 | 0.95 | 15.04% (+0.14) | |
| May 07, 2026 | 2026 (Q1) | 0.520.59 | 0.49 | 22.06% (+0.11) | |
| Mar 19, 2026 | 2025 (Q4) | 0.920.92 | 0.75 | 22.86% (+0.17) | |
| Nov 10, 2025 | 2025 (Q3) | 1.000.91 | 0.79 | 14.41% (+0.11) | |
| Aug 06, 2025 | 2025 (Q2) | 0.930.95 | 0.92 | 3.91% (+0.04) | |
| May 07, 2025 | 2025 (Q1) | 0.480.49 | 0.39 | 25.93% (+0.10) | |
| Mar 21, 2025 | 2024 (Q4) | 0.680.75 | 0.61 | 23.53% (+0.14) | |
| Nov 06, 2024 | 2024 (Q3) | 0.990.79 | 0.91 | -12.60% (-0.11) | |
| Aug 08, 2024 | 2024 (Q2) | 0.930.92 | 0.91 | 0.79% (+0.01) |
The table shows recent earnings report dates and whether the forecast was beat or missed. See the change in forecast and EPS from the previous year.
