


PicS N.V. Class A earnings date
Want to see PICS full AI Analyst Report?
PicS N.V. Class A (PICS) Q2 2026 Earnings Report
PICS Q2 2026 EPS Results
- Actual EPS
- $0.39
- Consensus EPS
- $0.40
- Beat/Miss
- Missed by -$0.01
- One Year Ago EPS
- $0.00
PICS Q2 2026 Revenue Results
- Actual Revenue
- $824.59M
- Expected Revenue
- $687.85M
- Beat/Miss
- Beat by +$136.74M
- YoY Revenue Growth
- +63.05%
Earnings Announcement Details
- Quarter
- Q2 2026
- Date
- 08/24/2026
- Time
- After Close
- Conference Call
- Monday, August 24, 2026
PicS N.V. Class A's next earnings date is estimated for March 24, 2027, based on past reporting schedules.
Q2 2026 Earnings Call Audio
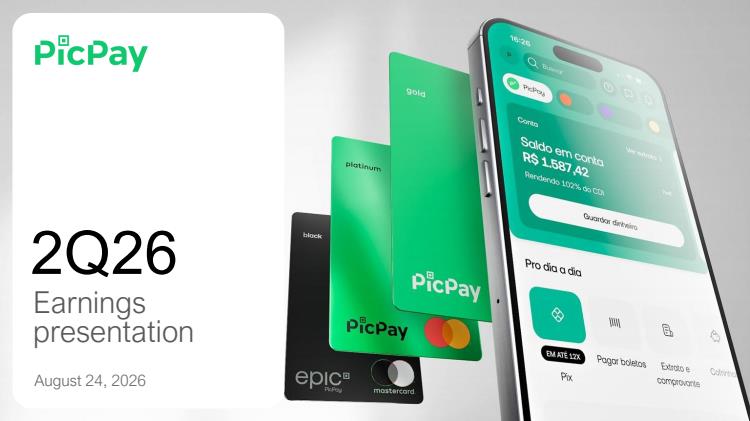
Q2 2026 Earnings Slide Deck
Q2 2026 Earnings Call Summary
The call presented materially positive operational and financial execution: strong revenue and profitability beats, significant monetization gains (ARPAC +52% YoY), operating leverage and AI-driven productivity, rapid growth in secured credit and noncredit revenue streams, and strategic completion of Kovr (KEV). The main headwinds are credit metrics driven by portfolio aging and deliberate incremental risk-taking in private payroll loans (higher NPL >90 days and Stage 3, modestly higher cost of risk and provisions), a temporary compression in Stage 3 coverage due to renegotiation mix, and a slight uptick in funding cost. Management provided reassuring context (provisioning coverage, Desenrola impact, capital headroom, guidance) and expects continued revenue and pretax earnings growth, with some Q3 net income normalization due to tax timing. On balance the positives around growth, profitability and diversification outweigh the portfolio-aging and intentional risk-taking challenges.
PicPay's Q3 2026 stand‑alone guidance (ex‑Kovr) calls for a total credit portfolio of ~BRL 34.7 billion; quarterly cost of risk of 3.9%–4.1%; managerial revenues of ~BRL 4.0 billion and net interest income of ~BRL 2.1 billion; gross profit of ~BRL 1.3 billion; IFRS earnings before taxes of ~BRL 360 million (≈+34% sequential) and adjusted EBT of ~BRL 378 million (≈+30% q/q); IFRS net income of ~BRL 255 million (≈‑5% q/q) and adjusted net income of ~BRL 265 million (≈‑6% q/q), with the sequential net income decline reflecting normalization after a concentrated Lei do Bem tax benefit in Q2. Management also reiterated funding and capital context (funding cost expected around ~95% of CDI and year‑end total capital ratio ≈14% with CET1 ≈12.0%–12.5%) and noted Kovr (KEV) is excluded from Q3 guidance but is expected to contribute roughly BRL 80–100 million of net income from August–December 2026.
- Top-line outperformance and strong revenue growthTotal revenues BRL 4.1 billion, up 67% year-over-year and 17% quarter-over-quarter; managerial revenues (ex-derivatives/hedge accounting) BRL 3.7 billion, up 59% year-over-year and 17% sequentially; revenues beat guidance (~3.6% above guidance).
- Material improvement in profitabilityAdjusted net income BRL 283 million, up 135% year-over-year and 67% sequentially; adjusted EBT BRL 291 million, up 174% year-over-year; gross profit BRL 1.25 billion, up 48% year-over-year and 14% sequentially; adjusted ROE 20.2% (from 15.5% prior quarter).
- Operating leverage and efficiency gainsAdjusted operating expenses grew far less than revenues (adjusted efficiency ratio improved to 44.8%, down 210 bps quarter-over-quarter); adjusted operating expenses were BRL 955 million; headcount flat since Oct 2025 with AI-driven productivity gains.
- Strong monetization per active clientARPAC BRL 92 per active client, up 52% year-over-year and 14% quarter-over-quarter (BRL 83.3 ex-hedge accounting), demonstrating stronger monetization and cross-sell success.
- Scale and engagement metricsTotal accounts 70.4 million (+10% YoY, +3% QoQ); quarterly active clients 45.4 million; consolidated TPV BRL 167.6 billion (+27% YoY, +7% QoQ); wallet & banking TPV BRL 142.6 billion (+19% YoY, +6% QoQ); total cash-in BRL 136.4 billion (+17% YoY, +9% QoQ).
- Diversifying revenue mix toward lower-risk streams71% of revenues now from no or lower credit risk streams (float, hedge accounting, fees/commissions, secured/partially secured credit), up from 63% a year ago; noncredit revenues BRL 1.9 billion (+57% YoY, +19% QoQ).
- Growth in secured credit and consumer lendingSecured credit revenues BRL 1.0 billion (+158% YoY, +23% QoQ); unsecured credit revenues BRL 1.2 billion (+40% YoY, +11% QoQ); consumer loan origination BRL 4.8 billion (+78% YoY, +7% QoQ); total credit portfolio BRL 31.9 billion (+99% YoY, +14% QoQ).
- Deposit and funding expansionDeposits BRL 35.8 billion (+45% YoY, +10% QoQ); funding base grew 10% quarter-over-quarter to BRL 35.8 billion; diversified funding including a new FIDC and capital markets issuances strengthened balance sheet.
- Insurance, SMB and product innovation momentumActive insurance policies 11.1 million (+63% YoY, +9% QoQ); acquisition of Kovr (now KEV) closed Aug 3 expected to contribute BRL 80–100 million net income Aug–Dec; SMB new accounts 85k/month H1 2026 vs 27k/month H1 2025; supply chain finance origination scaled to BRL 1.05 billion.
- AI-driven productivity and product rolloutAI platform reduced token costs ~70%, ~90% of employees using AI, doubled product deployments since start of year, launched consumer and SMB AI agents (marketing AI agent initial week: 10,000 opt-ins, 1,500 campaigns, 1.7 million individuals reached).
PICS Earnings History
| Report Date | Fiscal Quarter | Forecast / EPS | Last Year's EPS | EPS YoY Change | Press Release |
|---|---|---|---|---|---|
| Mar 24, 2027 | 2026 (Q4) | 0.35- | 0.28 | ― | ― |
| Nov 16, 2026 | 2026 (Q3) | 0.370.34 | 0.15 | 131.08% (+0.19) | |
| Aug 24, 2026 | 2026 (Q2) | 0.400.39 | 0 | ― | |
| Jun 02, 2026 | 2026 (Q1) | 0.230.25 | 0 | ― | |
| Mar 18, 2026 | 2025 (Q4) | 0.230.28 | 0 | ― | |
| Dec 05, 2025 | 2025 (Q3) | ―- | 85086.63 | ― | |
| Oct 01, 2025 | 2025 (Q2) | ―0.15 | 85086.63 | -100.00% (-85086.48) | |
| Jul 03, 2025 | 2025 (Q1) | ―0.00 | 0.03 | -100.00% (-0.03) |
The table shows recent earnings report dates and whether the forecast was beat or missed. See the change in forecast and EPS from the previous year.
