

Want to see PAA full AI Analyst Report?
Plains All American (PAA) Q2 2026 Earnings Report
PAA Q2 2026 EPS Results
- Actual EPS
- $0.41
- Consensus EPS
- $0.38
- Beat/Miss
- Beat by +$0.03
- One Year Ago EPS
- $0.36
PAA Q2 2026 Revenue Results
- Actual Revenue
- $17.68B
- Expected Revenue
- $12.72B
- Beat/Miss
- Beat by +$4.95B
- YoY Revenue Growth
- +65.47%
Earnings Announcement Details
- Quarter
- Q2 2026
- Date
- 08/07/2026
- Time
- Before Open
- Conference Call
- Friday, August 7, 2026
Plains All American's next earnings date is estimated for November 6, 2026, based on past reporting schedules.
Q2 2026 Earnings Call Audio
Q2 2026 Earnings Slide Deck
Q2 2026 Earnings Call Summary
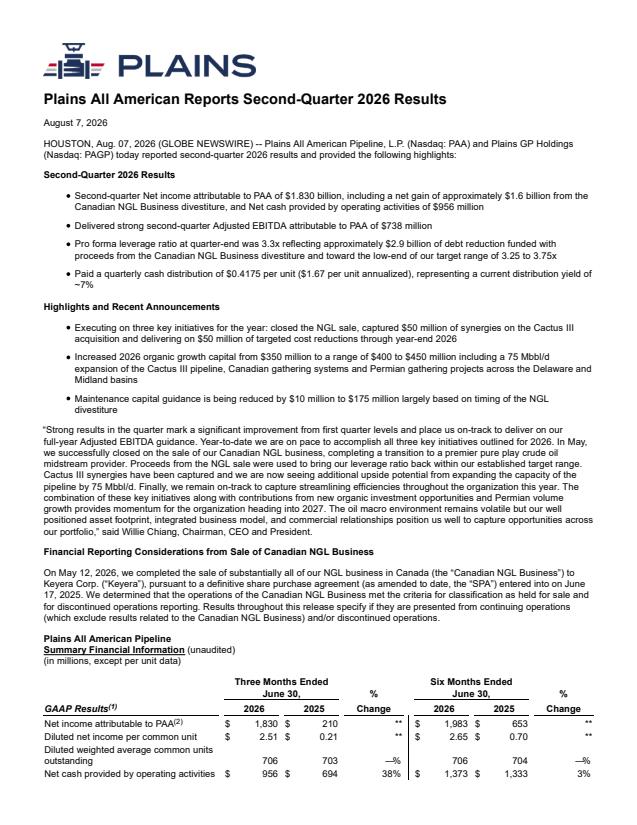
The call conveyed a predominantly positive operational and financial picture: strong Q2 adjusted EBITDA, meaningful free cash flow expectations, substantial deleveraging (~$2.9 billion) to a 3.3x pro forma leverage ratio, capture of Cactus III synergies and a low-cost expansion, and an increased growth-capex program focused on high-return, quick-hit projects. Management emphasized efficiency targets ($50M in 2026 and another $50M in 2027) and a disciplined capital allocation framework. The main negatives were macro / geopolitical uncertainty, a one-off $14M remediation charge, partial hedge coverage (~70%) leaving residual price exposure, and analyst concern that higher Permian volume forecasts did not lift 2026 EBITDA guidance (timing of benefits expected in 2027). Overall, the positives (operational execution, balance sheet repair, cash generation and strategic expansions) materially outweigh the lowlights.
Management reaffirmed robust 2026 targets and provided detailed metrics: Q2 adjusted EBITDA attributable to Plains was $738M (crude segment $690M; NGL $40M, including ~$14M one‑off remediation), and full‑year adjusted EBITDA guidance remains $2.88B ± $75M; pro forma leverage is 3.3x after roughly $2.9B of debt reduction from the May Canadian NGL sale. They raised growth capex to $400–450M (from $350M) while cutting maintenance capex to $175M, expect to capture $50M of efficiencies in 2026 and another $50M in 2027, forecast ~100k–200k bpd Permian exit‑to‑exit production growth in 2026, sanctioned a 75k bpd Cactus III expansion to 725k bpd (online by month‑end), are ~70% hedged on PLA revenue at an average WTI of ~$62, and expect roughly $1.75B of free cash flow in 2026 while continuing to return capital (targeted $0.15/unit annual increases).
- Cactus III Synergies and ExpansionCaptured targeted Cactus III synergies and sanctioned a capital-efficient expansion adding 75,000 barrels/day to bring Cactus III capacity to 725,000 barrels/day; expansion to be online by end of month and described as highly economic (low tens of millions of dollars incremental cost) with quick fill potential via marketing affiliate.
- Raised Growth Capital to Target Organic InvestmentsIncreased 2026 growth capital spending from $350 million to a range of $400–$450 million (an increase of approximately 14%–29%), targeting quick-hit projects (Permian gathering build-out, Canadian gathering expansions, and Cactus III expansion) expected to drive 2027 EBITDA and returns above hurdle rates.
- Improved Permian Production OutlookPermian exit-to-exit production now expected to grow by approximately 100,000–200,000 barrels/day in 2026 versus 2025 (upside driven by earlier-than-expected gas egress); management expects this ramp to build momentum into 2027.
- Efficiency Programs and Capital Allocation PrioritiesExpect to realize $50 million of organizational efficiencies by year-end 2026 and an additional $50 million by year-end 2027; maintenance capital lowered to $175 million; capital allocation framework emphasizes returning cash to unitholders (targeted $0.15 per unit annual increases), bolt-on acquisitions/organic CapEx, and balance sheet strength.
- Operational Growth and Marketing ExecutionManagement cited record crude exports in Q2, strong producer activity, and the commercial team's ability to capture market-based opportunities and volatility. Company highlighted ~7% compounded annual growth of crude over recent years and POPB JV dedicated Permian acreage of ~5.1 million acres.
- Strong Quarterly and Full-Year EBITDA PositioningReported second quarter adjusted EBITDA attributable to Plains of $738 million and crude oil segment adjusted EBITDA of $690 million (an increase of over $100 million from Q1). Management states they are on track to deliver full-year adjusted EBITDA guidance of $2.88 billion (± $75 million).
- Material Free Cash Flow and Debt ReductionExpect approximately $1.75 billion of free cash flow in 2026 and pro forma leverage reduced to 3.3x following the Canadian NGL business sale, which drove roughly $2.9 billion of debt reduction.
PAA Earnings History
| Report Date | Fiscal Quarter | Forecast / EPS | Last Year's EPS | EPS YoY Change | Press Release |
|---|---|---|---|---|---|
| Nov 06, 2026 | 2026 (Q3) | 0.41- | 0.39 | ― | ― |
| Aug 07, 2026 | 2026 (Q2) | 0.380.41 | 0.36 | 13.89% (+0.05) | |
| May 08, 2026 | 2026 (Q1) | 0.370.39 | 0.39 | 0.00% (+0.00) | |
| Feb 06, 2026 | 2025 (Q4) | 0.400.40 | 0.42 | -4.76% (-0.02) | |
| Nov 05, 2025 | 2025 (Q3) | 0.350.39 | 0.37 | 5.41% (+0.02) | |
| Aug 08, 2025 | 2025 (Q2) | 0.320.36 | 0.31 | 16.13% (+0.05) | |
| May 09, 2025 | 2025 (Q1) | 0.440.39 | 0.41 | -4.88% (-0.02) | |
| Feb 07, 2025 | 2024 (Q4) | 0.410.42 | 0.42 | 0.00% (+0.00) | |
| Nov 08, 2024 | 2024 (Q3) | 0.310.37 | 0.35 | 5.71% (+0.02) | |
| Aug 02, 2024 | 2024 (Q2) | 0.310.31 | 0.25 | 24.00% (+0.06) |
The table shows recent earnings report dates and whether the forecast was beat or missed. See the change in forecast and EPS from the previous year.
