


Orion Digital earnings date
Orion Digital (ORIO) Q2 2026 Earnings Report
ORIO Q2 2026 EPS Results
- Actual EPS
- $0.03
- Consensus EPS
- $0.02
- Beat/Miss
- Beat by +$0.01
- One Year Ago EPS
- $0.16
ORIO Q2 2026 Revenue Results
- Actual Revenue
- $11.93M
- Expected Revenue
- $12.15M
- Beat/Miss
- Missed by -$219.88K
- YoY Revenue Growth
- +0.00%
Earnings Announcement Details
- Quarter
- Q2 2026
- Date
- 08/06/2026
- Time
- Before Open
- Conference Call
- Thursday, August 6, 2026
Orion Digital's next earnings date is estimated for March 24, 2027, based on past reporting schedules.
Q2 2026 Earnings Call Audio
Q2 2026 Earnings Slide Deck
Q2 2026 Earnings Call Summary
The call highlighted meaningful improvement in profitability and cash generation driven by wealth growth, margin expansion and disciplined cost management, alongside the commercial launch of an AI-enabled investing product. Offsetting risks include flat consolidated revenue, declines in payments and interest revenue due to deliberate reduced lending deployment, expected second-half moderation in EBITDA as lending and commercialization spend ramps, and a NASDAQ minimum bid price notice. On balance, the positive financial momentum, clear capital allocation discipline, and product commercialization progress outweigh the near-term revenue headwinds and market-listing risk.
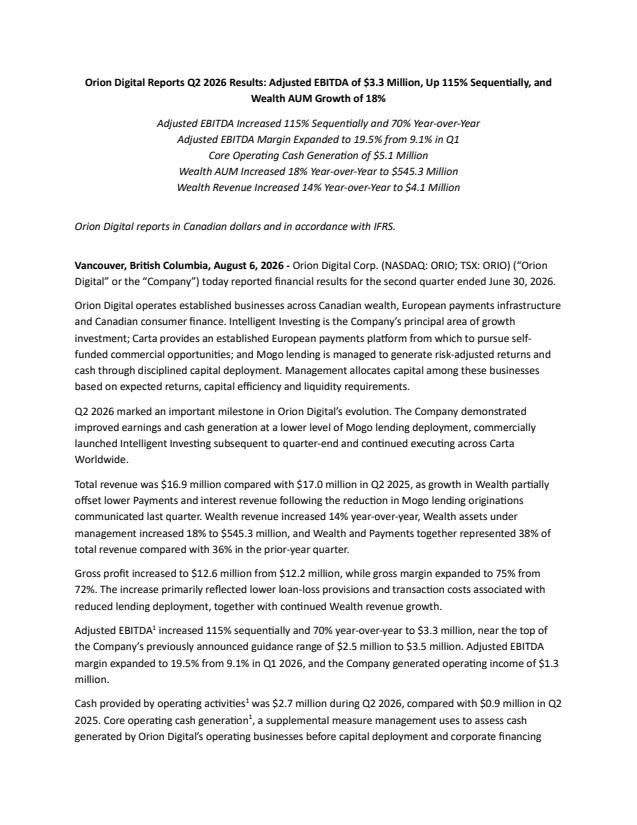
Orion reiterated its Q1 guidance and said it now expects full‑year adjusted EBITDA to be at the upper end of or exceed the previously communicated $6–$7 million range, while warning second‑half adjusted EBITDA will likely moderate as lending originations and commercialization spending ramp; Q2 results that support this outlook included adjusted EBITDA of $3.3 million (up 115% sequentially and 70% YoY) with a 19.5% margin, revenue of $16.9 million, wealth revenue of $4.1 million (up 14%) and AUM/client assets of $545.3 million (up 18%), gross margin of 75%, operating income of $1.3 million, gross loan receivables of $75.4 million with a $49.8 million lending credit facility, payments revenue of $2.4 million (down 9%), European transaction volume of $2.8 billion, interest revenue down 3%, cash from operations of $2.7 million (core operating cash generation $5.1 million), about $900k invested in platform growth and $1.65 million into loans, ~$1.6 million repaid on the lending facility plus just over $500k of debentures repaid, ending cash of ~$25.1 million (down ~$0.5 million), and a lending return framework targeting ~18–24 months.
- Large Adjusted EBITDA ImprovementConsolidated adjusted EBITDA of $3.3M, up 115% sequentially and 70% year-over-year; adjusted EBITDA margin expanded to 19.5%.
- Wealth Business Growth and AUM ExpansionClient assets (AUM) in consolidated wealth business reached $545.3M, up 18% year-over-year; wealth revenue increased 14% to $4.1M.
- Strong Gross Margin and Operating IncomeGross margin increased to 75% and the company generated $1.3M of operating income in the quarter.
- Improved Cash GenerationCash provided by operating activities was $2.7M versus $0.9M in the prior year period; core operating cash generation was $5.1M and, excluding a $3M prior-year nonrecurring receipt, core cash generation increased ~29%.
- Commercial Launch of Intelligent InvestingCommercial launch on July 27 of 'intelligent investing' — a commission-free, AI-supported investing experience built on existing regulatory and operational foundation; early customer engagement is encouraging and the company plans disciplined commercialization and customer acquisition investments.
- Stronger Full-Year EBITDA OutlookManagement expects full-year adjusted EBITDA to be at the upper end of or exceed prior guidance range of $6M to $7M based on stronger-than-expected first half performance.
- Disciplined Capital Allocation and Debt ReductionManagement emphasized a higher return threshold for lending originations (targeting ~18–24 month payback), invested $1.65M in the loan portfolio while repaying ~$1.6M on the lending credit facility and just over $500K of debentures; share repurchases continue to compete for capital.
- Platform Self-FundingCarta is positioned to fund ordinary platform investment and growth internally, reducing reliance on external capital for ongoing platform development.
ORIO Earnings History
| Report Date | Fiscal Quarter | Forecast / EPS | Last Year's EPS | EPS YoY Change | Press Release |
|---|---|---|---|---|---|
| Mar 24, 2027 | 2026 (Q4) | ―- | -0.05 | ― | ― |
| Nov 05, 2026 | 2026 (Q3) | ―-0.09 | -0.1 | 5.71% (+0.01) | |
| Aug 06, 2026 | 2026 (Q2) | 0.020.03 | 0.16 | -82.61% (-0.13) | |
| May 07, 2026 | 2026 (Q1) | -0.06-0.17 | -0.04 | -306.67% (-0.13) | |
| Mar 12, 2026 | 2025 (Q4) | -0.07-0.05 | -0.01 | -294.74% (-0.04) | |
| Nov 07, 2025 | 2025 (Q3) | -0.05-0.10 | -0.23 | 57.58% (+0.13) | |
| Aug 07, 2025 | 2025 (Q2) | -0.070.16 | -0.11 | 253.33% (+0.27) | |
| May 08, 2025 | 2025 (Q1) | -0.07-0.04 | -0.11 | 62.50% (+0.07) | |
| Mar 20, 2025 | 2024 (Q4) | -0.08-0.01 | -0.07 | 81.90% (+0.06) | |
| Nov 06, 2024 | 2024 (Q3) | -0.11-0.23 | -0.07 | -230.00% (-0.16) |
The table shows recent earnings report dates and whether the forecast was beat or missed. See the change in forecast and EPS from the previous year.
