

Nanosonics Limited (NNCSF) Q4 2026 Earnings Report
NNCSF Q4 2026 EPS Results
- Actual EPS
- $0.02
- Consensus EPS
- $0.02
- Beat/Miss
- Beat by +$0.00
- One Year Ago EPS
- $0.02
NNCSF Q4 2026 Revenue Results
- Actual Revenue
- $72.55M
- Expected Revenue
- $78.67M
- Beat/Miss
- Missed by -$6.13M
- YoY Revenue Growth
- -3.74%
Earnings Announcement Details
- Quarter
- Q4 2026
- Date
- 08/24/2026
- Time
- After Close
- Conference Call
- Monday, August 24, 2026
Nanosonics Limited's next earnings date is estimated for February 23, 2027, based on past reporting schedules.
Q4 2026 Earnings Call Audio
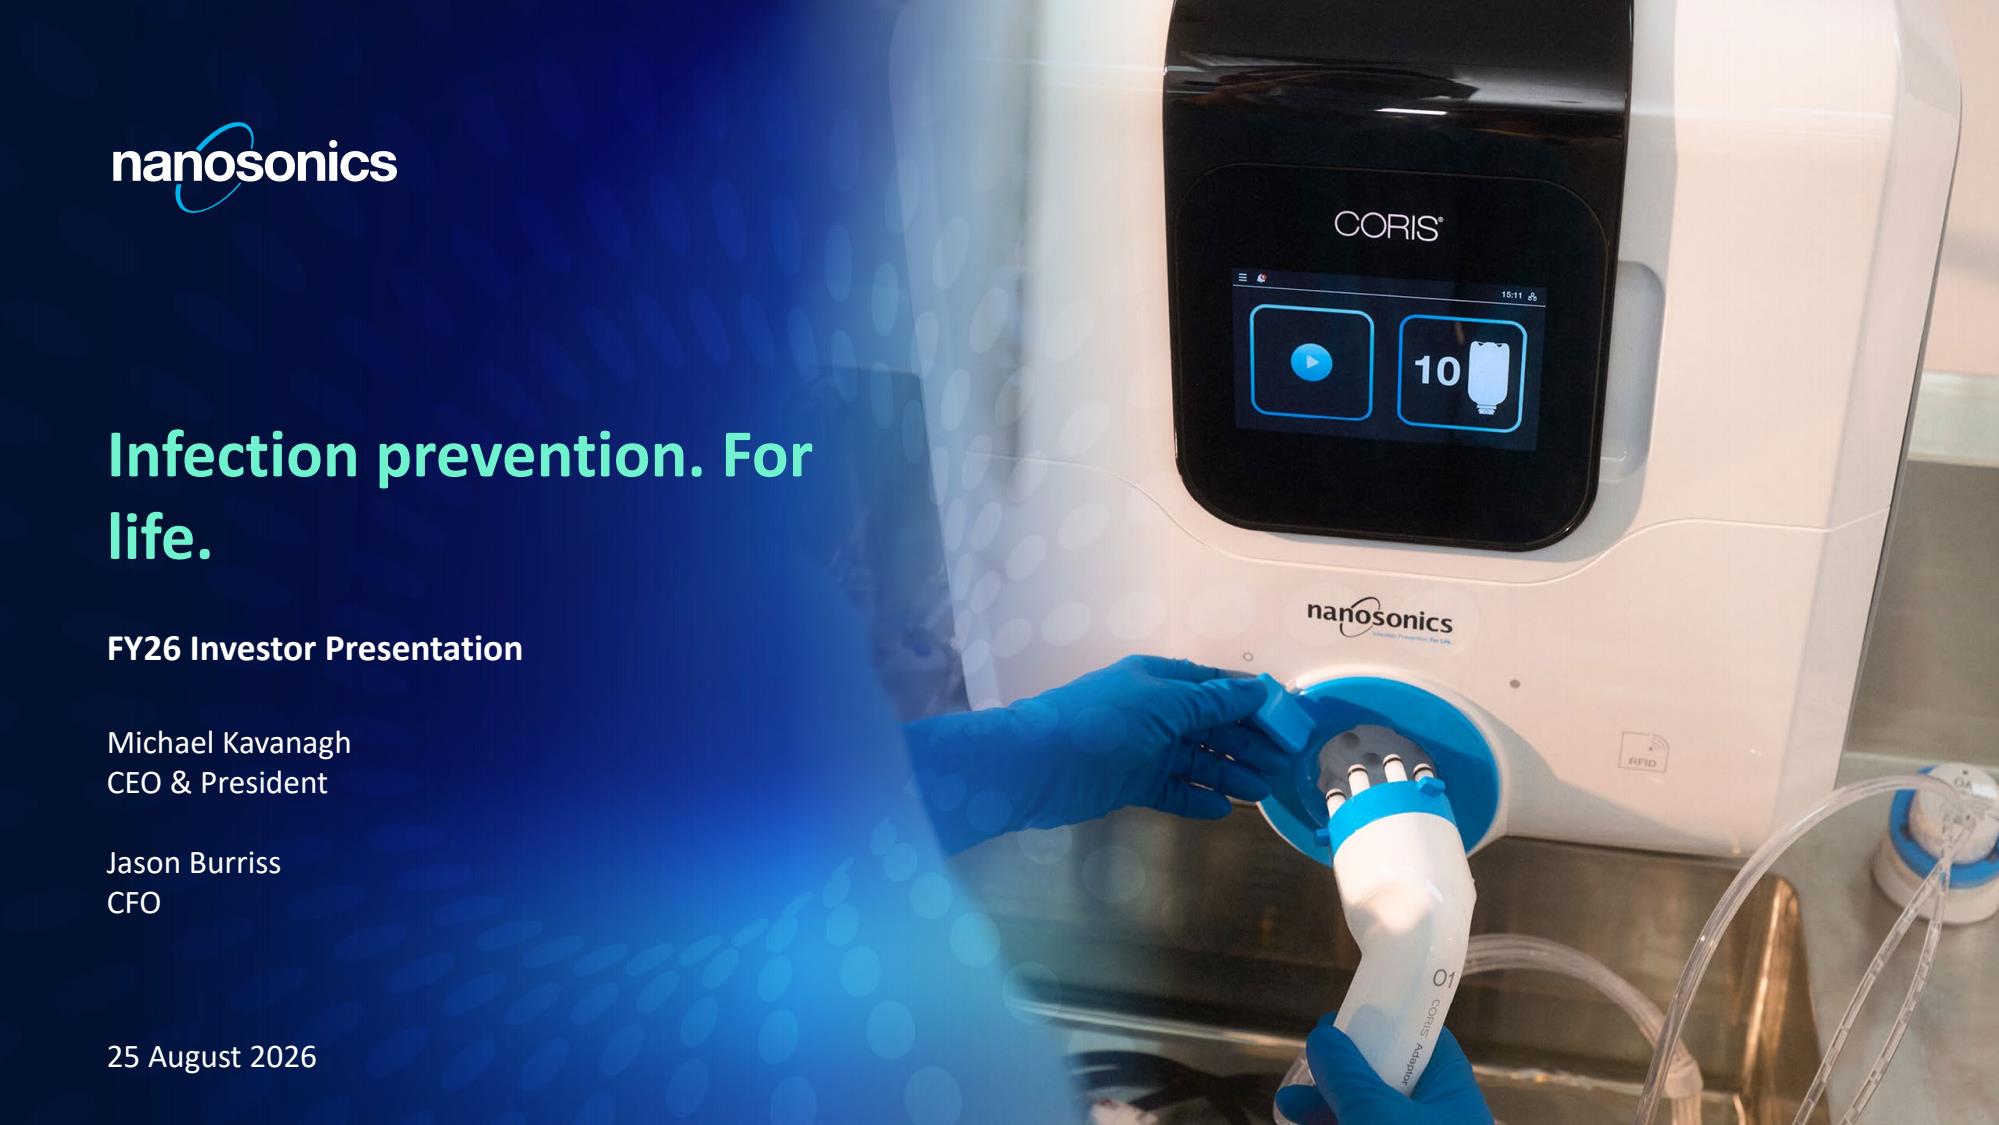
Q4 2026 Earnings Slide Deck
Q4 2026 Earnings Call Summary
The call presents a predominantly positive operational and financial picture: constant-currency revenue and EBIT growth, strong trophon profitability and cash generation, record placements and upgrades, product innovation (trophon3/trophon2 Plus), solid annuity and service growth, a debt-free balance sheet with substantial cash and an active buyback. Management also delivered substantial regulatory and commercial progress for CORIS and set explicit FY'27 guidance that anticipates continued growth. Negative items are present but largely manageable and/or transitional: a Q3 consumables dip due to weather, margin moderation from product mix and currency, APAC softness tied to rental models, and elevated near-term OpEx to fund CORIS commercialization which will weigh on near-term profitability. Overall, highlights substantially outweigh the lowlights, with CORIS viewed as a meaningful long-term growth opportunity while trophon continues as a strong cash engine.
Management guided FY'27 constant‑currency revenue of $220–$228 million (≈8–12% growth on FY'26), gross profit margin of 74–76% (reflecting a ~12.5% tariff headwind and higher freight), and operating expenses of $156–$163 million (with the majority of the OpEx step‑up funding the CORIS commercial launch); CORIS is expected to deliver initial revenues in the low single‑digit millions, the company announced an additional on‑market buyback of up to $40 million (after completing $20 million in FY'26) and reiterated that trophon will continue to drive operating leverage and cash (trophon‑only EBIT FY'26: ~$50.6M reported / $56.5M cc). They also outlined CORIS unit economics: capital pricing 3–5× trophon, ~10 cycles per unit per day (3–4× trophon), price per cycle 4–6× trophon and higher expected service take‑rates (80–100% vs trophon’s ~55–60%).
- Constant Currency Revenue GrowthFY'26 constant currency revenue grew 6% to $211.5M (reported revenue $203.9M, up 3% on PCP).
- Strong EBIT Expansion (Constant Currency)EBIT was $21.6M on a constant currency basis, up 21% year-on-year (reported EBIT $16.0M).
- Trophon Franchise Profitability and Cash GenerationTrophon-only reported EBIT was $50.6M (constant currency $56.5M, up 16%); trophon remains highly profitable and cash generative, enabling investment and shareholder returns.
- Record and Improving Unit PlacementsTotal trophon placements were 4,230 units (up 9%); North America placed a record 3,880 devices (up 13%) and new installed base additions were 2,230 units, lifting cumulative installed base to 39,230 units (up 6%).
- Upgrade MomentumUpgrades were a record year: 2,000 upgrades (up 20% overall), with North America upgrades up 32% (1,980 units) and ~8,000 first-generation devices remain addressable in North America.
- Annuity and Service GrowthAnnuity revenue grew 4% reported to $141.8M (8% at constant currency); core consumables +4% (constant currency), ecosystem revenue +6% (constant currency), and service revenue +19% (constant currency).
- Product Innovation and AdoptionLaunched trophon3 and trophon2 Plus; trophon3 became dominant in Q4, strengthening ASPs and contributing to improved capital pricing in H2.
- CORIS Regulatory Progress and Imminent Commercial LaunchCORIS achieved regulatory clearances in the U.K., Europe, Australia and first FDA 510(k) for expanded indications; commercial launch planned in H1 FY'27 with initial revenue expected in the low single-digit millions.
- Manufacturing and Operations ExpansionEstablished a dedicated CORIS manufacturing line in Australia, expanded Indianapolis facility to locally manufacture trophon consumables and CORIS QUANTUM consumables, and planning a Q3 move to a new HQ/manufacturing site to support growth.
- Strong Balance Sheet and Capital ReturnCash and cash equivalents of $155.2M at FY'26 end, business cash flow $13.6M (ex-buyback), completed $20M buyback and announced up to $40M further on-market buyback; debt-free balance sheet.
- Tariff RecoveryRecovered $2.5M in U.S. tariffs paid under the International Emergency Economic Powers Act (residual FY'26 tariffs recognized of $0.6M).
- FY'27 Guidance Indicates Continued GrowthGuidance for FY'27 constant currency revenue $220M–$228M (8%–12% growth), gross margin expected 74%–76%, and OpEx $156M–$163M reflecting CORIS launch investments.
NNCSF Earnings History
| Report Date | Fiscal Quarter | Forecast / EPS | Last Year's EPS | EPS YoY Change | Press Release |
|---|---|---|---|---|---|
| Feb 23, 2027 | 2027 (Q2) | 0.01- | 0.02 | ― | ― |
| Aug 24, 2026 | 2026 (Q4) | 0.020.02 | 0.02 | -14.71% (-0.00) | |
| Feb 23, 2026 | 2026 (Q2) | 0.020.02 | 0.02 | -3.13% (-0.00) | |
| Aug 25, 2025 | 2025 (Q4) | 0.020.02 | 0.02 | 54.55% (+0.01) | |
| Feb 19, 2025 | 2025 (Q2) | 0.020.02 | 0.01 | 60.00% (+0.01) | |
| Aug 26, 2024 | 2024 (Q4) | 0.010.02 | 0.02 | -29.03% (-0.01) | |
| Feb 25, 2024 | 2024 (Q2) | 0.010.01 | 0.02 | -41.18% (-0.01) | |
| Aug 21, 2023 | 2023 (Q4) | 0.010.02 | 0 | ― | |
| Feb 22, 2023 | 2023 (Q2) | 0.020.02 | 0.01 | 161.54% (+0.02) | |
| Aug 22, 2022 | 2022 (Q4) | -0.020.00 | 0.02 | -100.00% (-0.02) |
The table shows recent earnings report dates and whether the forecast was beat or missed. See the change in forecast and EPS from the previous year.
