

Constellation Brands (STZ) Stock Price & Analysis
STZ Stock Chart & Stats
- Day’s Range
- MXN 2,520.00 - MXN 2,539.00
- 52-Week Range
- MXN 2,010.00 - MXN 2,900.00
- Previous Close
- MXN 2,440.63
- Volume
- 0
- Average Volume (3M)
- 722
- Market Cap
- MXN 430.21B
- Enterprise Value
- MXN 32.79B
- Total Cash (Recent Filing)
- MXN 98.50M
- Total Debt (Recent Filing)
- MXN 10.32B
- Price to Earnings (P/E)
- 12.1
- Beta
- 0.17
- Next Earnings
- Jan 07, 2027 (Est.)
- EPS Estimate
- 51.47
- Next Dividend Ex-Date
- N/A
- Dividend Yield
- 3.04%
Bulls Say, Bears Say
Bulls Say
Beer Market Position
Leading dollar-share gains and beer performance indicate that Constellation’s major brands retain strong consumer relevance and distribution momentum. A stronger market position can support durable pricing, retailer access, and reinvestment capacity over the next several quarters.
Margin Improvement Program
The scale of realized cost efficiencies provides evidence of an established operating-improvement capability rather than reliance only on favorable demand. Continued productivity can help offset inflation, protect margins, and fund marketing or innovation while supporting earnings resilience.
Innovation And Portfolio Expansion
Adding a high-growth ready-to-drink brand broadens Constellation’s portfolio beyond its established beer base and gives the company exposure to an emerging category. The brand’s expected scale and distribution runway could create a durable source of incremental growth.
Bears Say
Earnings Volatility
Repeated loss years and a recent revenue decline show that strong margins in some periods have not translated into consistently stable earnings. This volatility can make planning, capital allocation, and shareholder returns less predictable over the medium term.
Weaker Cash Conversion
The sharp deterioration in trailing cash conversion reduces the reliability of reported profitability as a source of internally generated funds. If sustained, weaker operating cash flow could constrain reinvestment, debt reduction, dividends, or repurchases despite historically stronger cash generation.
Leverage And Future Margin Headwind
Historically meaningful leverage increases financial sensitivity when earnings weaken, while the Veracruz investment will add recurring depreciation once operational. Together, these factors may limit flexibility and create pressure to sustain productivity and demand growth.
Constellation Brands News




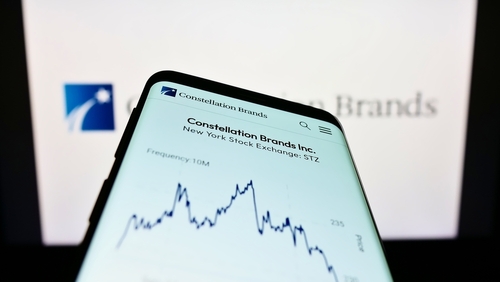




Why Did Constellation Brands Stock Fall over 4% in After-Hours Trading on October 6?
Constellation Brands ($STZ) stock fell 4.5% in after-hours trading on Tuesday, October 6, after the beverage company reported its fiscal second-quarter results. Comparable earnings came in at $3.74 per share,
STZ FAQ
What was Constellation Brands’s price range in the past 12 months?
What is Constellation Brands’s market cap?
When is Constellation Brands’s upcoming earnings report date?
How were Constellation Brands’s earnings last quarter?
Is Constellation Brands overvalued?
Does Constellation Brands pay dividends?
What is Constellation Brands’s EPS estimate?
How many shares outstanding does Constellation Brands have?
What happened to Constellation Brands’s price movement after its last earnings report?
Which hedge fund is a major shareholder of Constellation Brands?
What is the TipRanks Smart Score and how is it calculated?
Constellation Brands Stock Smart Score
Company Description
Constellation Brands
Constellation Brands, Inc., together with its subsidiaries, produces, imports, markets, and sells beer, wine, and spirits in the United States, Canada, Mexico, New Zealand, and Italy. The company offers beer under the Corona Extra, Corona Familiar, Corona Hard Seltzer, Corona Light, Corona Non-Alcoholic, Corona Premier, Corona Refresca, Modelo Especial, Modelo Chelada, Modelo Negra, Modelo Oro, Victoria, Vicky Chamoy, and Pacifico brands. It also offers wine under the Cook’s California Champagne, Kim Crawford, Meiomi, Mount Veeder, Ruffino, SIMI, My Favorite Neighbor, Robert Mondavi Winery, Schrader, and The Prisoner Wine Company brands; and spirits under the Casa Noble, Copper & Kings, High West, Mi CAMPO, Nelson’s Green Brier, and SVEDKA brands. The company provides its products to wholesale distributors, retailers, on-premise locations, and state alcohol beverage control agencies. Constellation Brands, Inc. was founded in 1945 and is based in Rochester, New York.
- Sector
- Consumerdefensive
- Industry
- Beverages - Alcoholic
- CEO
- Nicholas Fink
- Employees
- 9,400
- Website
- www.cbrands.com
- Address
- 50 East Broad Street, Rochester, NY, 14614, US
Constellation Brands (STZ) Earnings & Revenues
STZ Earnings Call
Earnings Call SentimentPositive
The call was strongly optimistic. Management reported a quarterly beat, reiterated fiscal 2027 guidance, cited improving September trends, leading share gains, healthy distributor inventories, strong growth from Pacifico, Victoria, Mi CAMPO, and SpikedAde, and substantial capital allocation flexibility. The main challenges were seasonal second-half margin pressures, higher planned marketing and SG&A spending, flat Q2 price/mix, Corona's performance still being below expectations, and a future depreciation headwind from Veracruz. Highlights significantly outweighed the lowlights.
View all MX:STZ earnings summariesSTZ Net sales Breakdown
- 90.99% Beer
- 9.01% Wine and Spirits
- 0.00% Corporate Operations and Other

STZ Stock 12 Month Forecast
Average Price Target
Technical Analysis
Overall Consensus
| Indicator | Bullish | Neutral | Bearish |
|---|---|---|---|
| Overall Consensus | 15 | 6 | 1 |
| Technical Analysis | 3 | 6 | 1 |
| Moving Averages | 12 | 0 | 0 |