

Cenovus Energy (CVEN) Q3 2026 Earnings Report
MX:CVEN Q3 2026 EPS Results
- Actual EPS
- MXN 24.34
- Consensus EPS
- MXN 21.23
- Beat/Miss
- Beat by +MXN 3.11
- One Year Ago EPS
- MXN 9.58
MX:CVEN Q3 2026 Revenue Results
- Actual Revenue
- MXN 212.57B
- Expected Revenue
- MXN 224.36B
- Beat/Miss
- Missed by -MXN 11.79B
- YoY Revenue Growth
- +21.14%
Earnings Announcement Details
- Quarter
- Q3 2026
- Date
- 11/04/2026
- Time
- Before Open
- Conference Call
- Wednesday, November 4, 2026
Cenovus Energy's next earnings date is estimated for February 9, 2027, based on past reporting schedules.
Q3 2026 Earnings Call Audio
Q3 2026 Earnings Slide Deck
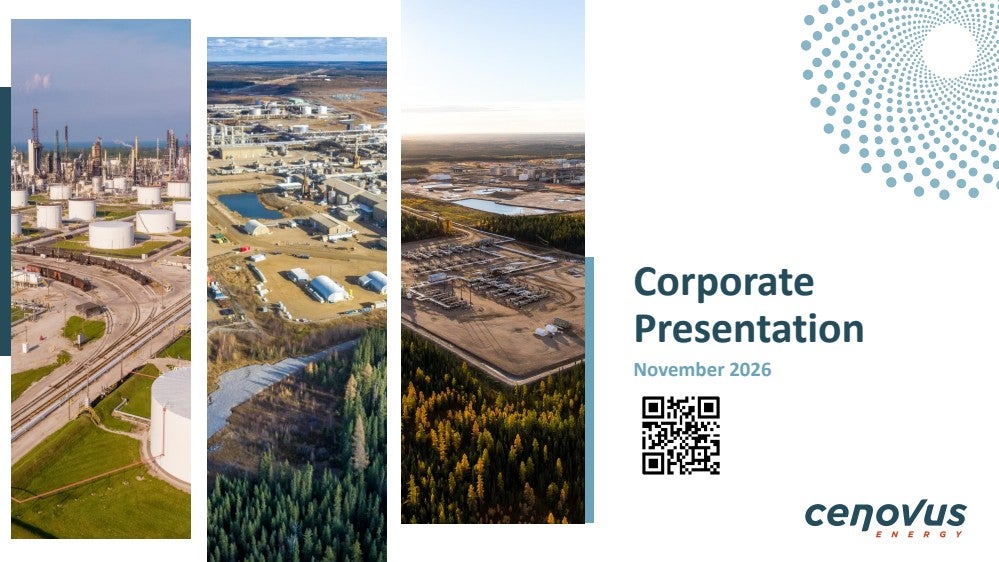
Q3 2026 Earnings Call Summary
The call was strongly positive, characterized by record upstream production, record operating margin and adjusted funds flow, lower oil sands unit costs, strong refining performance, substantial debt reduction, shareholder returns, and progress on growth initiatives. The main challenges were lower benchmark oil prices, a wider heavy differential, turnaround-related U.S. refining impacts, higher expected capital spending, anticipated inflationary pressure, and uncertainty around regulatory and carbon-capture agreements. The highlights significantly outweighed the lowlights.
Cenovus expects full year production to come in over 1 million BOE a day closer to the high end of its guidance range of 970 thousand to 1.01 million BOE a day, with capital investment at the top end or slightly above its guidance range of $5 billion to $5.3 billion; Christina Lake North is expected to reach a 2026 exit rate of around 125 thousand barrels per day, Spruce Lake Dilsap is expected to add about 10 thousand barrels a day when it comes online in 2028, and West White Rose first oil is imminent, with subsequent production wells expected every 90 to 100 days and gross production ramping to roughly 80 thousand barrels a day by 2028-2029; the fifth Narrows Lake well pad is expected to be online near the end of the year, two additional Sunrise pads are planned for next year, and the Athabasca transaction is anticipated to close in December subject to the remaining approvals and customary closing conditions.
- Strong Safety PerformanceCenovus successfully executed four major turnarounds over the past 18 months without a recordable injury. The Christina Lake turnaround was completed safely, ahead of schedule, and under budget.
- Upstream Production Surpassed One Million BOE per DayThird-quarter upstream production increased by more than 50 thousand BOE per day from the prior quarter to nearly 1.025 million BOE per day, surpassing the 1 million BOE per day milestone. Oil sands production exceeded 830 thousand barrels per day and set a third consecutive quarterly production record.
- Christina Lake Reached Record ProductionChristina Lake reached an all-time high of 381 thousand barrels per day. Strong production at Narrows Lake and Christina Lake North more than offset the planned turnaround, which was completed in September ahead of schedule and with less production impact than expected. The turnaround was shortened by four days, reducing its production impact by approximately 180 thousand barrels.
- Narrows Lake and Christina Lake North Continued to ExpandNarrows Lake production reached as high as 82 thousand barrels per day during the quarter, and its fifth well pad is being steamed with production expected near the end of the year. At Christina Lake North, 22 redevelopment wells were online by the end of September and contributed more than 115 thousand barrels per day during the quarter. The facility expansion remained ahead of plan, and the asset is expected to exit 2026 at around 125 thousand barrels per day, approximately 15 thousand to 20 thousand barrels per day above the level when Cenovus acquired it.
- Foster Creek Achieved Record ProductionFoster Creek production reached an all-time high of 148 thousand barrels per day, up more than 30 thousand barrels per day from the second quarter. Six new well pads have been brought online so far this year following completion of the Foster Creek optimization project, with initial reservoir performance described as exceptional.
- Sunrise Reached Its 2027 Production Target EarlySunrise averaged 70 thousand barrels per day in the quarter, achieving a production target originally set for 2027. Production has increased by approximately 25 thousand barrels per day from around 45 thousand barrels per day when Cenovus acquired full ownership in 2022. The second East Side pad is online, with two additional pads planned for next year.
- Lloydminster and Spruce Lake GrowthLloydminster thermal assets averaged more than 100 thousand barrels per day during the quarter. Construction is progressing on the Spruce Lake Dilsap project, which is expected to add approximately 10 thousand barrels per day when it comes online in 2028.
- Oil Sands Unit Costs Reached New LowsOil sands unit operating costs have declined by nearly $3 per barrel over the past four years and were the lowest since Cenovus acquired Husky in 2021. Oil sands nonfuel operating costs were $7.80 per barrel, down almost $0.50 per barrel from the second quarter, while management said portfolio-wide oil sands operating costs were approximately $10 per barrel during the quarter.
- West White Rose Approached First OilCenovus completed drilling the first West White Rose production well, with completion and tie-in activities underway. The first well package includes seven wells, consisting of five producers and two injectors, with subsequent wells expected approximately every 90 to 100 days. Gross production is expected to ramp to roughly 80 thousand barrels per day by 2028-2029.
- Record Canadian Refining ThroughputCanadian refining crude throughput reached a record 120 thousand barrels per day, or approximately 112% utilization. Both the Lloyd upgrader and refinery operated above rated capacity, while the Lloydminster upgrader achieved record diesel production of approximately 18 thousand barrels per day.
- Record Downstream Operating MarginStrong financial product pricing drove benchmark cracks to historic levels in the third quarter. Downstream operating margin reached approximately $1.8 billion, nearly double the prior quarter. Canadian refining contributed approximately $420 million, supported by record throughput and strong synthetic and diesel margins.
- Strong U.S. Refining Market CaptureU.S. refining generated approximately $1.4 billion of operating margin, and adjusted market capture increased to 88% from 67% in the second quarter. Excluding one-time items such as small refinery exemption waivers at Superior, market capture was over 80%.
- Expanded Product Market AccessCenovus began utilizing its share of the 40-thousand-barrel-per-day Laurel pipeline expansion in September, providing an additional outlet for Chicago-market products. Together with continued movements through the Toledo dock, this increased access to higher-value markets in PADD 1 and the Great Lakes region. The company reported record performance through the Toledo dock in the quarter.
- Record Operating Margin and Adjusted Funds FlowCenovus generated approximately $6.3 billion of operating margin and $5 billion of adjusted funds flow in the third quarter, both quarterly records.
- Significant Debt Reduction and Shareholder ReturnsNet debt declined by another $2.4 billion during the quarter to $3 billion, supported primarily by a $830 million increase in income taxes payable related to timing differences between accruals and cash payments. Net debt has been reduced by approximately $5.1 billion over the last two quarters. Cenovus returned $1.9 billion to shareholders, including $1.5 billion through share purchases and $430 million through dividends.
- Balanced Capital AllocationManagement said the company's cash-generating capacity allows it to strengthen the balance sheet, invest in growth, make record royalty and tax payments to governments, and return significant cash to shareholders. Total royalties and taxes recognized in the quarter were $3 billion.
- Raised Full-Year Production ExpectationsCenovus now expects full-year production to exceed 1 million BOE per day, closer to the high end of its guidance range of 970 thousand to 1.01 million BOE per day.
- Athabasca Acquisition ProgressedManagement described the Athabasca Oil acquisition as providing a high-quality oil sands resource base with decades of development potential adjacent to Cenovus's existing lands. The Athabasca shareholder meeting is scheduled for November 27, and Cenovus anticipates closing the transaction in December, subject to remaining approvals and customary closing conditions. Cenovus also stated that its 9.9% stake is intended to add deal certainty.
- Integrated Model and Future Investment OpportunitiesManagement said wider heavy differentials reinforce the value of Cenovus's integrated model. The company is evaluating investments to expand Toledo dock access, improve distillate, jet and diesel yields, optimize Ohio Valley operations, and improve yields and margins at Canadian facilities.
- Positive Progress on Carbon Capture and Infrastructure InitiativesManagement said discussions involving a six-megaton carbon capture project, incremental 10 megatons, government support, the West Coast Oil pipeline, a potential Alberta growth incentive royalty, and related system supports were progressing. The company remained on a path toward the November 15 timeline, while noting that the agreements are new and bespoke.
MX:CVEN Earnings History
| Report Date | Fiscal Quarter | Forecast / EPS | Last Year's EPS | EPS YoY Change | Press Release |
|---|---|---|---|---|---|
| Feb 09, 2027 | 2026 (Q4) | 22.70- | 6.65 | ― | ― |
| Nov 04, 2026 | 2026 (Q3) | 21.2324.34 | 9.58 | 154.17% (+14.76) | |
| Jul 29, 2026 | 2026 (Q2) | 21.8520.35 | 5.98 | 240.00% (+14.36) | |
| May 06, 2026 | 2026 (Q1) | 10.6311.04 | 6.25 | 76.60% (+4.79) | |
| Feb 19, 2026 | 2025 (Q4) | 5.276.65 | 0.93 | 614.29% (+5.72) | |
| Oct 31, 2025 | 2025 (Q3) | 6.859.58 | 5.59 | 71.43% (+3.99) | |
| Jul 31, 2025 | 2025 (Q2) | 1.775.98 | 7.05 | -15.09% (-1.06) | |
| May 08, 2025 | 2025 (Q1) | 5.196.25 | 8.25 | -24.19% (-1.99) | |
| Feb 20, 2025 | 2024 (Q4) | 2.650.93 | 5.19 | -82.05% (-4.26) | |
| Oct 31, 2024 | 2024 (Q3) | 5.815.59 | 12.9 | -56.70% (-7.31) |
The table shows recent earnings report dates and whether the forecast was beat or missed. See the change in forecast and EPS from the previous year.
