


Bentley Systems earnings date
Bentley Systems (BSY) Q3 2026 Earnings Report
MX:BSY Q3 2026 EPS Results
- Actual EPS
- MXN 6.70
- Consensus EPS
- MXN 6.16
- Beat/Miss
- Beat by +MXN 0.54
- One Year Ago EPS
- MXN 5.02
MX:BSY Q3 2026 Revenue Results
- Actual Revenue
- MXN 7.84B
- Expected Revenue
- MXN 7.82B
- Beat/Miss
- Beat by +MXN 15.23M
- YoY Revenue Growth
- +12.24%
Earnings Announcement Details
- Quarter
- Q3 2026
- Date
- 11/05/2026
- Time
- Before Open
- Conference Call
- Thursday, November 5, 2026
Bentley Systems's next earnings date is estimated for March 2, 2027, based on past reporting schedules.
Q3 2026 Earnings Call Audio
Q3 2026 Earnings Slide Deck
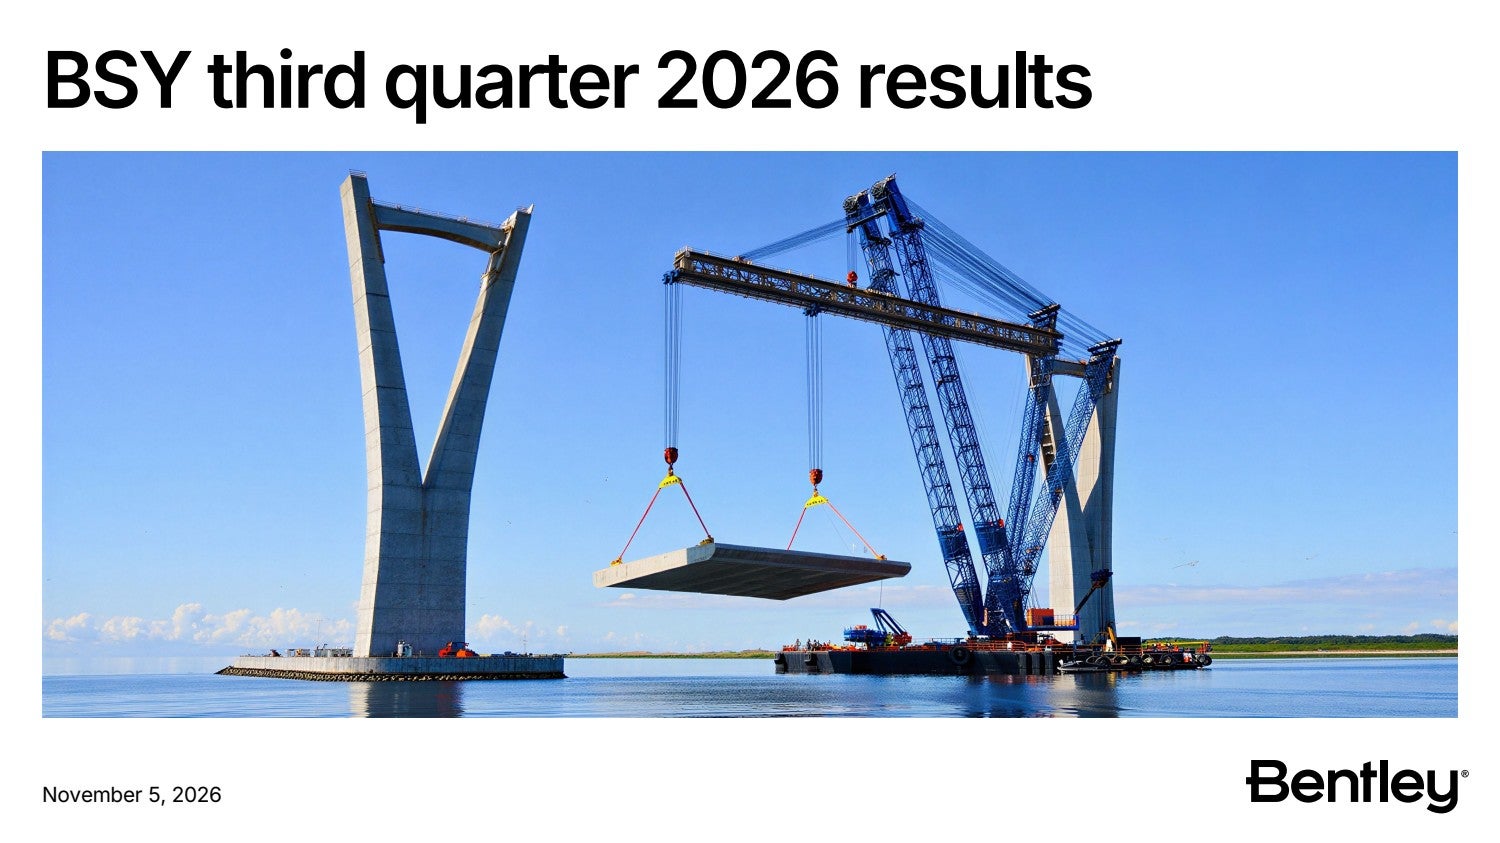
Q3 2026 Earnings Call Summary
The call was strongly positive. Highlights included accelerating 13% ARR growth, record 110% net revenue retention, broad-based sector and geographic demand, strong subscription performance, higher profitability, a raised ARR outlook, and growing AI and Asset Analytics traction. The principal challenges were the near-term revenue reduction from the Cohesive divestiture, lower year-to-date free cash flow, foreign exchange pressure, persistent China headwinds, flat commercial and facilities growth, and the still-early stage of AI design monetization. The highlights significantly outweighed the lowlights.
Bentley raised its 2026 ARR growth outlook, excluding the impact of the divestiture of Cohesive, to 12.5% to 13.5%, above the high end of its original range of 10.5% to 12.5%, with Eliis expected to contribute approximately 100 basis points; including the divestiture, reported ARR growth is expected to be approximately 100 basis points lower. Updated total revenue guidance is $1.673 billion to $1.703 billion, with constant currency subscription revenues growth towards the high end of the 11% to 13% outlook range and constant currency perpetual licenses and services revenues expected to remain approximately flat. Services revenues are expected to decline year-over-year through 2027 and represent less than 3% of total revenues, while subscriptions will represent approximately 95% of total revenues. AOI less operating SBC guidance remains $495 million to $510 million, free cash flow is expected within the $500 million to $570 million outlook range, cash taxes are expected to be approximately $55 million to $60 million, and weighted average diluted shares approximately $319 million. Cohesive is expected to reduce fourth quarter revenues by approximately $12 million, about 3/4 of it in services, and AI monetization in design is expected to start in 2027 but is not expected to be a material growth driver in 2027.
- ARR Growth Accelerated to 13%Year-over-year constant-currency ARR growth accelerated to 13% in Q3 2026, ahead of expectations, above the high end of the annual outlook range, and marking the second consecutive quarter of acceleration. Sequential constant-currency ARR growth was 3.1%, all organic, compared with 2.2% in Q3 2025.
- Record Net Revenue Retention and Strong Account RetentionNet revenue retention reached a historical high of 110%, while the last-12-month constant-currency account retention rate remained 99%. Management attributed the performance to high retention rates and new business momentum.
- Revenue and Subscription GrowthQ3 total revenue was $422 million, up 12.2% year-over-year and 12.7% in constant currency. Subscription revenue increased 12.4% year-over-year and 12.9% in constant currency, representing 92% of total revenue. Year-to-date total revenue increased 13.2%, while subscription revenue increased 13.5%.
- New Logo and SMB MomentumNew logos contributed approximately 300 basis points of ARR growth, primarily through the SMB business. Through the Virtuoso commercial program, Bentley added more than 600 new logos, and management said SMB accounts had healthy project backlogs and increased interest in AI.
- Broad-Based Sector PerformanceResources was the fastest-growing sector overall, supported by sustained strength in mining. Public works and utilities delivered another quarter of strong growth, fueled by global infrastructure spending and grid modernization. Industrial growth remained solid, particularly in power generation.
- Strong Seequent and Mining DemandSeequent delivered another standout quarter, driven by sustained strength in mining. Mining companies continued prioritizing brownfield optimization and expansion to meet demand for critical minerals, electrification, supply chain security, and AI data-center construction.
- Asset Analytics ExpansionAsset Analytics contributed meaningfully to both year-over-year and sequential ARR growth, with large contract expansions from existing accounts accounting for approximately half of the improvement in sequential growth over the prior year. Q3 included strategic enterprise expansions in telecommunications tower inspection, road monitoring, and transportation infrastructure AI.
- AI Monetization Already Underway in Asset AnalyticsManagement said AI monetization is already occurring through Asset Analytics. Q3 included multiple deals with existing accounts for telecommunications tower inspection and road monitoring, while significant expansion deals were signed with existing equipment-manufacturer accounts.
- AI Adoption and Engineering Productivity ExamplesMore than 25% of Year in Infrastructure submissions and nearly 70% of finalists used AI in their projects. AYESA used AI agents with PLAXIS to run more than 100 simulations instead of a handful, producing a 30% reduction in design cost and saving 4,500 cubic meters of concrete.
- Infrastructure Cloud and Digital Twin OpportunityAlmost half of the 346 ex-China BI500 owner accounts already leverage Bentley Infrastructure Cloud for at least part of their infrastructure engineering. Management described Asset Analytics as the keystone for connecting CapEx and OpEx by using AI, reality capture, continuous surveying, and engineering-grade digital twins.
- Infrastructure Market Exposure Viewed as ResilientManagement said less than one-quarter of enterprise revenue is directly from government, revenue directly from the U.S. federal government is less than 1%, and privately owned infrastructure represents a larger share of the collective infrastructure asset value of top owners than publicly owned infrastructure. The company also cited infrastructure spending financed through utility rates, user fees, motor fuel and vehicle taxes, and other dedicated sources.
- Geographic Strength Outside ChinaGrowth accelerated across North America and Latin America, with Latin America delivering an exceptional quarter led by mining and water infrastructure. EMEA delivered solid performance, led by the Middle East, while Asia Pacific was the fastest-growing region, supported by strong growth in India, Australia and New Zealand, and Southeast Asia.
- Strong U.S. and Infrastructure Program ActivityManagement described the U.S. macro environment as very healthy, with engineering accounts operating at capacity and robust backlogs supported by federal and state public funding and private capital. Departments of Transportation continued to advance digital delivery initiatives, and private AI data-center investment generated tailwinds across the portfolio.
- Eliis Acquisition Expands Subsurface CapabilitiesThe Eliis acquisition adds seismic interpretation to Seequent's subsurface portfolio, expanding applications across oil and gas, geothermal energy, carbon capture, mining, transport corridors, tunneling, offshore wind, and other civil infrastructure. Management said the acquisition is accretive to ARR growth, roughly in line with Bentley from a margin standpoint, and accretive to the revenue multiple.
- Raised 2026 ARR Growth OutlookExcluding the Cohesive divestiture, Bentley raised its 2026 ARR growth outlook to 12.5% to 13.5%, above the original range of 10.5% to 12.5%. Eliis is expected to contribute approximately 100 basis points. Including the divestiture, reported ARR growth is expected to be approximately 100 basis points lower.
- Profitability Ahead of ExpectationsQ3 adjusted operating income less operating stock-based compensation was $135 million, with a 32.1% margin versus 28.1% a year ago. Year-to-date adjusted operating income less operating stock-based compensation was $392 million, with a 31.2% margin versus 30.7% a year ago. Management cited a mix shift toward subscription revenue and disciplined cost control.
- Balance Sheet and Capital Allocation FlexibilityYear-to-date, Bentley reduced net debt by $88 million, repurchased $168 million of shares, and paid $64 million in dividends. The company ended the quarter with approximately $150 million of cash, $1.26 billion of revolver availability, and net debt leverage of 1.7x adjusted EBITDA versus 1.9x in the prior quarter.
- Maintained Profit and Cash Flow OutlookBentley maintained its adjusted operating income less operating stock-based compensation outlook of $495 million to $510 million and its free cash flow outlook of $500 million to $570 million, including higher cash taxes related to the Cohesive transaction. Management expects subscription revenue growth toward the high end of the 11% to 13% outlook range.
- Improving Digital Integration Opportunity Through NaviamBentley merged Cohesive into Naviam in exchange for becoming a significant minority investor in a fast-growing, profitable recurring-revenue business. Management said Naviam will add Bentley Infrastructure Cloud and iTwin technology to its Maximo services offering, with Bentley's former Cohesive colleagues included in the services force.
- Strong Renewal and Enterprise PipelineE365 renewal performance remained strong, supported by solid floor uplifts. Management said Q4 is the company's largest quarter for E365 renewals, that it has reasonable visibility into the pipeline, and that reaching the high end of the updated outlook will require continued strength in resources, public works and utilities, grid, renewals, and larger Asset Analytics deals.
MX:BSY Earnings History
| Report Date | Fiscal Quarter | Forecast / EPS | Last Year's EPS | EPS YoY Change | Press Release |
|---|---|---|---|---|---|
| Mar 02, 2027 | 2026 (Q4) | 5.90- | 5.02 | ― | ― |
| Nov 05, 2026 | 2026 (Q3) | 6.166.70 | 5.02 | 33.33% (+1.67) | |
| Aug 06, 2026 | 2026 (Q2) | 5.886.51 | 5.95 | 9.38% (+0.56) | |
| May 07, 2026 | 2026 (Q1) | 6.607.07 | 6.51 | 8.57% (+0.56) | |
| Feb 26, 2026 | 2025 (Q4) | 4.845.02 | 3.91 | 28.57% (+1.12) | |
| Nov 05, 2025 | 2025 (Q3) | 5.115.02 | 2.42 | 107.69% (+2.60) | |
| Aug 06, 2025 | 2025 (Q2) | 5.305.95 | 5.77 | 3.23% (+0.19) | |
| May 07, 2025 | 2025 (Q1) | 5.646.51 | 5.77 | 12.90% (+0.74) | |
| Feb 26, 2025 | 2024 (Q4) | 4.043.91 | 3.72 | 5.00% (+0.19) | |
| Nov 07, 2024 | 2024 (Q3) | 4.502.42 | 4.09 | -40.91% (-1.67) |
The table shows recent earnings report dates and whether the forecast was beat or missed. See the change in forecast and EPS from the previous year.
