


MMG earnings date
MMG (MMLTF) Q2 2026 Earnings Report
MMLTF Q2 2026 EPS Results
- Actual EPS
- $0.07
- Consensus EPS
- $0.09
- Beat/Miss
- Missed by -$0.02
- One Year Ago EPS
- $0.03
MMLTF Q2 2026 Revenue Results
- Actual Revenue
- $4.53B
- Expected Revenue
- $4.68B
- Beat/Miss
- Missed by -$151.11M
- YoY Revenue Growth
- +61.82%
Earnings Announcement Details
- Quarter
- Q2 2026
- Date
- 08/11/2026
- Time
- Before Open
- Conference Call
- Tuesday, August 11, 2026
MMG's next earnings date is estimated for March 9, 2027, based on past reporting schedules.
Q2 2026 Earnings Call Audio
Q2 2026 Earnings Slide Deck
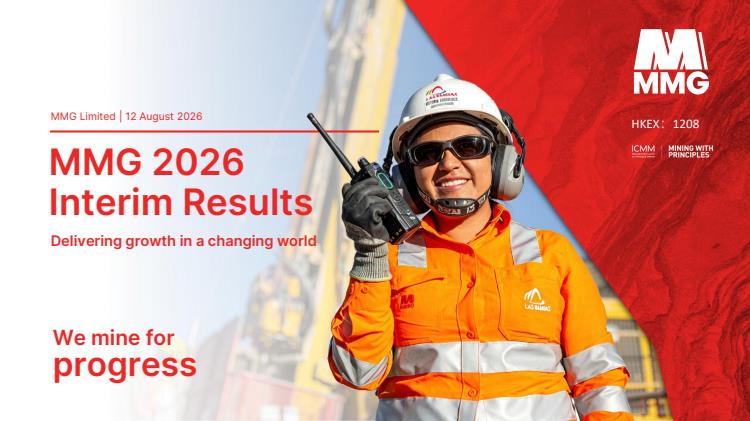
Q2 2026 Earnings Call Summary
The call conveyed a strongly positive operational and financial performance for H1 2026: record revenue, EBITDA, profit and cash flow, major debt reduction and meaningful resource growth. Multiple assets reported strong quarter-on-quarter and year-on-year improvements and the company has clear growth projects (Khoemacau expansion, Kinsevere ramp) and a defined capital allocation framework. Notable near-term risks include input cost inflation (diesel, sulfuric acid), localized production grade declines, regulatory/political uncertainty in the DRC, and a delayed Nickel Brazil approval process. While these lowlights create execution and cost volatility, they do not outweigh the substantial improvements in profitability, liquidity, resources and strategic momentum.
Management guided that MMG remains on track to deliver full‑year targets after a record H1: revenue US$4.54bn, EBITDA US$2.73bn (60% margin), profit after tax US$1.37bn (≈US$900m attributable), and operating cash flow US$2.23bn (up 89%); net debt was cut to US$610m and gearing to 6% (from 33%) after ~US$1.6bn financing in June (expected to save ~US$30–40m p.a.). Operational guidance kept FY Las Bambas copper at 380–400kt (H1 210kt; group H1 copper 267kt — highest H1 in ~8 years), Kinsevere ramping (H1 34kt, +33%), Khoemacau progressing to a 130kt expansion (H1 22kt; first concentrate targeted H1 2028) while longer‑term pathways to 200kt are being assessed, Dugald River zinc 87kt (H1, +3%, Zn recovery >90%), Rosebery zinc 19kt (H1, -21% but +3% zinc‑equivalent). Capital and cost guidance: H1 CapEx ~US$550m with FY CapEx guided US$1.6–1.7bn, Las Bambas C1 ~US$0.55/lb in H1, and management signalled continued discipline on hedging (H1 hedging cash outflow ~US$220m) and a progressive approach to shareholder returns as cash generation and balance sheet strength allow. Resource and exploration guidance remained constructive: total copper mineral resources ≈20Mt contained (up 7%, ≈+1.4Mt), maiden Kgwebe ~1.4Mt Cu and ~90Moz Ag, with exploration spend expanded (US$102m in 2025; US$56.3m H1 2026). Safety and sustainability targets were reiterated (significant event frequency with energy exchange ≈0.6, TRIF ≈2.1 per million hours; community investment >US$60m H1).
- Record Revenue and ProfitRevenue reached USD 4.54 billion in H1 2026, up 61% year-on-year. Profit after tax was USD 1.37 billion and profit attributable to equity holders was ~USD 900 million (up 164%).
- Strong EBITDA, Margin and Cash GenerationEBITDA was USD 2.73 billion with an EBITDA margin of 60%. Net operating cash flow exceeded USD 2.23 billion, up 89% year-on-year.
- Substantially Stronger Balance SheetNet debt fell to USD 610 million, total borrowings ~USD 2.57 billion, and gearing reduced from 33% to 6%. A ~USD 1.6 billion financing completed in June is expected to save USD 30–40 million of interest expense per year.
- Company-wide Copper Production and Asset PerformanceGroup copper production was 267,000 tonnes in H1 — the highest H1 in nearly eight years. Las Bambas produced 210,000 tonnes in H1 and remains on track for full-year guidance of 380,000–400,000 tonnes.
- Strong Performance at Key OperationsLas Bambas revenue USD 3.31 billion (up 65%) and EBITDA margin 68%. Kinsevere copper production 34,000 t (up 33%), revenue USD 398 million (up 70%) and EBITDA ~4x prior year. Dugald River zinc production 87,000 t (up 3%), revenue USD 340 million (up 50%), EBITDA up 92% to ~USD 130 million. Rosebery revenue USD 244 million (up 73%) and EBITDA USD 130 million.
- Byproduct Contributions and Multimetal AdvantageHigher contributions from gold, silver and molybdenum byproducts materially improved earnings quality and lowered reported unit costs, supporting competitive C1 metrics (Las Bambas H1 cited around USD 0.55/lb).
- Significant Resource Growth and Exploration InvestmentCopper mineral resources increased to ~20 million tonnes contained (up 7%, net +1.4 million t). This is the third consecutive year of copper resource growth. Maiden resource at Kgwebe (Khoemacau) ~1.4 million t copper and 90 million oz silver. Exploration spend rose from USD 19.1 million (2020) to USD 102 million (2025), with USD 56.3 million in H1 2026.
- Clear Growth Pathway and Projects ProgressKhoemacau Phase 2 (130,000 tpa) remains on track with first concentrate targeted H1 2028; company is evaluating longer-term pathway to 200,000 tpa copper. Kinsevere expansion (KEP) is ramping and delivering capacity benefits.
- Capital Allocation and Shareholder Return FrameworkManagement outlined five capital allocation priorities including sustaining operations, deleveraging, disciplined growth, technology/innovation and progressive shareholder returns; signal of intent to pursue dividends once technical/timing obstacles are cleared.
- Community and Sustainability InvestmentCommunity investment exceeded USD 60 million (Las Bambas majority). Continued focus on safety improvements, automation/electrification and digital initiatives (remote operations center, digital twin, electric trials). Safety metrics improved: significant event frequency ~0.6 and TRIFR ~2.1 per million hours.
MMLTF Earnings History
| Report Date | Fiscal Quarter | Forecast / EPS | Last Year's EPS | EPS YoY Change | Press Release |
|---|---|---|---|---|---|
| Mar 09, 2027 | 2026 (Q4) | 0.06- | 0.01 | ― | ― |
| Aug 11, 2026 | 2026 (Q2) | 0.090.07 | 0.03 | 153.57% (+0.04) | |
| Mar 03, 2026 | 2025 (Q4) | 0.020.01 | 0.02 | -50.00% (-0.01) | |
| Aug 12, 2025 | 2025 (Q2) | 0.030.03 | 0 | 1300.00% (+0.03) | |
| Mar 04, 2025 | 2024 (Q4) | 0.020.02 | 0.01 | 122.22% (+0.01) | |
| Aug 13, 2024 | 2024 (Q2) | 0.010.00 | -0.01 | 133.33% (+0.01) | |
| Mar 05, 2024 | 2023 (Q4) | -0.010.01 | 0.01 | 0.00% (+0.00) | |
| Aug 15, 2023 | 2023 (Q2) | 0.01-0.01 | 0.01 | -166.67% (-0.01) | |
| Mar 07, 2023 | 2022 (Q4) | 0.000.01 | 0.03 | -67.86% (-0.02) | |
| Aug 18, 2022 | 2022 (Q2) | 0.040.01 | 0.05 | -80.43% (-0.04) |
The table shows recent earnings report dates and whether the forecast was beat or missed. See the change in forecast and EPS from the previous year.
