


Lightspeed POS Inc earnings date
Lightspeed POS Inc (LSPD) Q2 2027 Earnings Report
LSPD Q2 2027 EPS Results
- Actual EPS
- $0.17
- Consensus EPS
- $0.17
- Beat/Miss
- Beat by +$0.00
- One Year Ago EPS
- $0.16
LSPD Q2 2027 Revenue Results
- Actual Revenue
- $318.09M
- Expected Revenue
- $321.09M
- Beat/Miss
- Missed by -$3.01M
- YoY Revenue Growth
- +3.19%
Earnings Announcement Details
- Quarter
- Q2 2027
- Date
- 11/05/2026
- Time
- Before Open
- Conference Call
- Thursday, November 5, 2026
Lightspeed POS Inc's next earnings date is estimated for February 4, 2027, based on past reporting schedules.
Q2 2027 Earnings Call Audio
No earnings call audio is available for this earnings event.
Q2 2027 Earnings Slide Deck
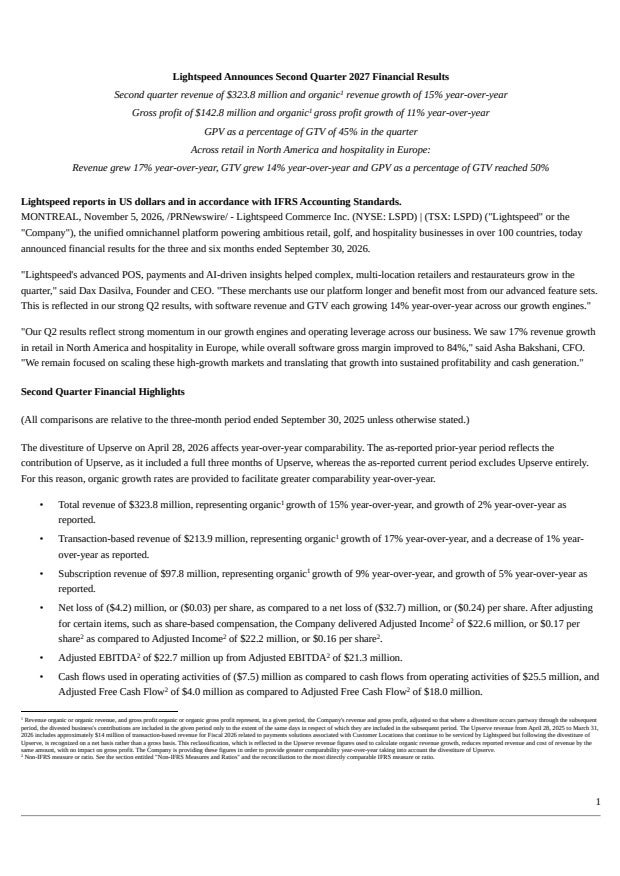
Q2 2027 Earnings Call Summary
The call was predominantly positive. Revenue growth reached the high end of guidance, the core growth engines outperformed, software growth and ARPU accelerated, payments penetration improved, profitability and free cash flow progressed, and fiscal 27 guidance was maintained. The main challenges were softer net location additions, a decline in total gross margin, still-negative hardware margins, organizational reductions, and a lower cash balance, but management emphasized that these actions and metrics support its longer-term transformation.
Fiscal 27 outlook remains unchanged: total revenue of $1.225 billion to $1.265 billion, representing organic growth of 12% to 15%, total gross profit of $565 million to $585 million, representing organic growth of 12% to 16%, and adjusted EBITDA of $75 million to $95 million; for Q3 of fiscal 27, the company expects total revenue of $310 million to $320 million, representing organic growth of 11% to 15%, total gross profit of $141 million to $146 million, representing organic growth of 11% to 15%, and adjusted EBITDA of $25 million to $30 million. The company expects hardware margins to continue to improve significantly in the second half of this fiscal year and into fiscal 28, adjusted free cash flow to deliver significant growth this fiscal year compared with last year's $18.2 million, and remains on track to meet its free cash flow target of $95 million for fiscal 28.
- Revenue Growth at High End of OutlookOrganic second-quarter revenue increased 15% year over year to $323.8 million, at the high end of the 12% to 16% outlook range.
- Growth Engines Continued to OutperformNorth American retail and European hospitality revenue grew 17% year over year and represented 77% of total revenue, up from 67% a year ago. Within these growth engines, software revenue and GTV each grew 14%, while locations grew 8%.
- Software Growth and ARPU AccelerationTotal software revenue was $97.8 million, up 9% year over year, while software revenue in the growth engines increased 14%, up from 12% last quarter. Organic software ARPU grew 7%, up from 6% last quarter, and total monthly ARPU reached approximately $688, up 12% year over year.
- Higher-Quality Customer AdditionsNew customer locations in the growth engines came on with 27% more software revenue on average than a year ago. Management said larger, more established customers generally buy more software, generate more payments revenue, stay longer, and provide higher lifetime value.
- Payments Penetration ImprovedCompany-wide payments penetration reached 45%, up from 40% a year ago on an organic basis. Payments penetration in the growth engines increased to 50% from 46% a year ago, with every eligible new customer taking payments.
- Transaction-Based Revenue and GTV GrowthTransaction-based revenue increased 17% year over year to $213.9 million, and GPV grew 19% year over year. Overall GTV increased 8% to $25.8 billion, while GTV in the growth engines increased 14%.
- Strong Software Gross MarginOrganic software gross margin improved to 84% from 82% in the same quarter last year. Management attributed the improvement largely to high-GTV customers adopting more software and AI resolving 80% of support tickets, reducing support and service delivery costs.
- Hardware Margin Improved SequentiallyHardware gross margin improved to negative 59% from negative 74% last quarter. Management expects hardware margins to continue improving significantly in the second half of the fiscal year and into fiscal 28, supported by demand forecasting, secured inventory pricing, and tighter hardware discounting.
- Profitability and Net Loss ImprovedAdjusted EBITDA increased to $22.7 million from $21.3 million a year ago and represented 16% of gross profit. Net loss improved to $4.2 million, or $0.03 per share, from $32.7 million, or $0.24 per share, a year ago.
- Positive Adjusted Free Cash FlowAdjusted free cash flow was $4 million, up CAD8.5 million from the prior quarter. Excluding cash used for the merchant cash advance business and share buybacks, overall cash flow was $10.9 million. Management expects adjusted free cash flow to grow significantly this fiscal year compared with $18.2 million last year.
- Lightspeed Capital ExpansionHigh-margin Lightspeed Capital revenue grew 42% year over year. Merchant cash advances outstanding reached $143 million at quarter end, and management said customers using Lightspeed Capital exhibit significantly lower churn and generate higher lifetime value. Payback periods remained approximately seven months, with defaults in the low single-digit range.
- Product Innovation and Agentic AI RolloutLightspeed launched agentic AI capabilities in retail that can answer questions, provide recommendations, and prepare tasks such as inventory updates, clearance tagging, and stock-transfer planning with customer visibility and approval. Management said AI usage was increasing 20% to 30% month by month and described plans for additional proactive AI-agent capabilities.
- Broad Product EnhancementsRetail launches included Meta Conversions API, AI Doc Import, Omni customer accounts, and a direct ShipStation connection. Hospitality launches included AI-generated dashboard reporting, Reserve with Google, new customer-display hardware, and upgraded Scan to Pay. Lightspeed Golf also launched OnDeck for preferred tee-time requests.
- Partner Channel and New Order MomentumThe partner channel contributed a marquee multi-location win, the Great Canadian Dollar Store with 73 locations. New Order continued to provide opportunities for the outbound team, and management reported success rolling out payments to the New Order customer base.
- Efficiency-Market Revenue GrowthRevenue in efficiency markets grew in the very high single digits, supported primarily by upselling and cross-selling Lightspeed Payments and Lightspeed Capital. Payments penetration in these markets reached 31%, which management said remained below the overall business level.
- Share Repurchases and Balance Sheet PositionLightspeed repurchased $98 million of its own shares year to date, including $11.2 million during the quarter. Issued and outstanding shares were down 5% year over year. Management described the balance sheet as healthy and ended the quarter with approximately $343 million in cash.
- Fiscal 27 Guidance MaintainedThe company maintained its fiscal 27 outlook for total revenue of $1.225 billion to $1.265 billion, representing organic growth of 12% to 15%; total gross profit of $565 million to $585 million, representing organic growth of 12% to 16%; and adjusted EBITDA of $75 million to $95 million. Fiscal Q3 guidance calls for revenue of $310 million to $320 million, gross profit of $141 million to $146 million, and adjusted EBITDA of $25 million to $30 million.
- Cost Efficiency and Transformation ProgressManagement said it continued to remove costs and improve productivity as part of its multiyear transformation. Approximately 10% of product and technology headcount was removed during the quarter, and approximately 250 roles were eliminated after quarter end, including open vacancies. Management said some savings would flow to the bottom line while some would be reinvested in the growth portfolio.
- Strong European PerformanceManagement reported strong performance across Europe, including approximately 30% year-over-year growth in outbound motions across North America and EMEA. It also described continued progress in European hospitality despite significant market dynamics and a competitive environment.
LSPD Earnings History
| Report Date | Fiscal Quarter | Forecast / EPS | Last Year's EPS | EPS YoY Change | Press Release |
|---|---|---|---|---|---|
| Feb 04, 2027 | 2027 (Q3) | 0.20- | 0.15 | ― | ― |
| Nov 05, 2026 | 2027 (Q2) | 0.170.17 | 0.16 | 6.25% (+0.01) | |
| Jul 30, 2026 | 2027 (Q1) | 0.120.13 | 0.06 | 116.67% (+0.07) | |
| May 21, 2026 | 2026 (Q4) | 0.110.08 | 0.1 | -20.00% (-0.02) | |
| Feb 05, 2026 | 2026 (Q3) | 0.140.15 | 0.12 | 25.00% (+0.03) | |
| Nov 06, 2025 | 2026 (Q2) | 0.120.16 | 0.13 | 23.08% (+0.03) | |
| Jul 31, 2025 | 2026 (Q1) | 0.130.06 | 0.1 | -40.00% (-0.04) | |
| May 22, 2025 | 2025 (Q4) | 0.110.10 | 0.06 | 66.67% (+0.04) | |
| Feb 06, 2025 | 2025 (Q3) | 0.100.12 | 0.08 | 50.00% (+0.04) | |
| Nov 07, 2024 | 2025 (Q2) | 0.110.13 | 0.04 | 225.00% (+0.09) |
The table shows recent earnings report dates and whether the forecast was beat or missed. See the change in forecast and EPS from the previous year.
