


E.ON SE stock analysis
E.ON SE (1EOAN) Stock Price & Analysis
1EOAN Stock Chart & Stats
- Day’s Range
- EUR 18.88 - EUR 18.88
- 52-Week Range
- EUR 9.00 - EUR 29.00
- Previous Close
- EUR 19.16
- Volume
- N/A
- Average Volume (3M)
- 895
- Market Cap
- EUR 50.03B
- Enterprise Value
- EUR 92.05B
- Total Cash (Recent Filing)
- EUR 4.26B
- Total Debt (Recent Filing)
- EUR 42.80B
- Price to Earnings (P/E)
- 14.7
- Beta
- 0.13
- Next Earnings
- Feb 24, 2027 (Est.)
- EPS Estimate
- 0.17
- Next Dividend Ex-Date
- N/A
- Dividend Yield
- 3.01%
Bulls Say, Bears Say
Bulls Say
Regulated Network Base
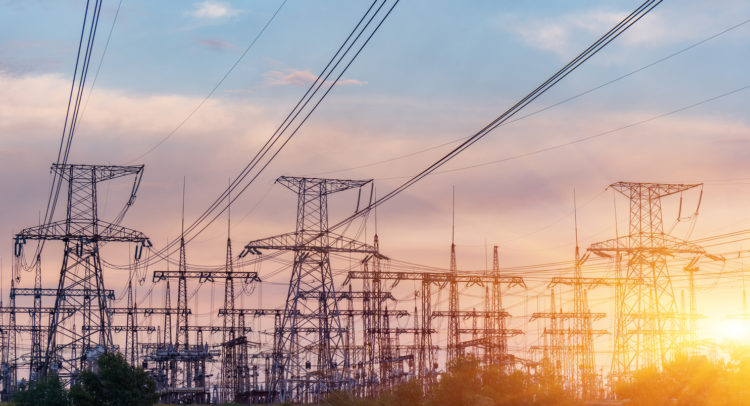
E.ON’s regulated electricity and gas distribution networks provide an infrastructure-like earnings foundation, with tariffs designed to recover operating costs and investment plus an allowed return. This supports revenue visibility and helps anchor performance through changing energy-market conditions.
Improved Profitability
The TTM improvement in net income and margins indicates stronger current profitability across the business. If sustained, better operating earnings can support internal investment, strengthen debt-servicing capacity, and provide a more resilient base for funding network modernization and customer solutions.
Solid Operating Cash Flow
Operating cash flow of 7.64B demonstrates that E.ON’s operations generate substantial cash in absolute terms, while improvement versus the prior two years is constructive. This cash generation can help fund capital needs and reduce reliance on external financing, even though conversion remains imperfect.
Bears Say
Declining Revenue Base
A multi-year decline in revenue, including a sharp TTM reduction, weakens confidence in the stability of the reported top line. Persistent contraction can limit operating leverage, reduce the scale available to absorb fixed costs, and make future earnings improvement more dependent on margins or portfolio changes.
Elevated Leverage
Debt of 42.8B against equity of 21.2B leaves E.ON with elevated leverage even for a capital-intensive utility. The resulting financial burden reduces flexibility for network investment, increases sensitivity to financing conditions, and can constrain capital allocation if earnings or cash generation weaken.
Recurring Negative Free Cash Flow
Negative free cash flow in the TTM period and most recent years indicates that operating cash has generally not covered investment and working-capital requirements. Continued funding needs may increase dependence on debt or other financing, limiting resilience and reducing flexibility to pursue additional growth projects.
E.ON SE News





1EOAN FAQ
What was E.ON SE’s price range in the past 12 months?
What is E.ON SE’s market cap?
When is E.ON SE’s upcoming earnings report date?
How were E.ON SE’s earnings last quarter?
Is E.ON SE overvalued?
Does E.ON SE pay dividends?
What is E.ON SE’s EPS estimate?
How many shares outstanding does E.ON SE have?
What happened to E.ON SE’s price movement after its last earnings report?
Which hedge fund is a major shareholder of E.ON SE?
What is the TipRanks Smart Score and how is it calculated?
E.ON SE Stock Smart Score
Company Description
E.ON SE
E.ON SE is an international energy utility, operating extensively across Germany, the United Kingdom, Sweden, the Netherlands, Belgium, and other European and global markets. The company's activities are structured into two core divisions. Its Energy Networks segment is responsible for managing and maintaining electricity and gas distribution infrastructure, along with providing related support services. The Customer Solutions segment supplies power, gas, and heating, while also offering products and services designed to enhance energy efficiency for a diverse clientele, including residential consumers, small and medium-sized enterprises, large commercial and industrial entities, sales partners, and public sector organizations. Additionally, E.ON is engaged in the operation, generation, and eventual decommissioning of nuclear power facilities in Germany and Turkey. The company also provides a suite of specialized technological solutions, such as SmartSim, a software aiding the integration of renewable gases into existing grids; tools for gas quality tracking; GasPro, a portable gas sample collection device; various metering solutions; and GasCalc, a software for calculating the properties of natural gases, LNG, and biogases. Founded in 1923, E.ON SE is headquartered in Essen, Germany.
- Sector
- General
- Industry
- Diversified Utilities
- CEO
- Leonhard Birnbaum
- Employees
- 78,322
- Website
- www.eon.com
- Address
- Brüsseler Platz 1, Essen, NW, 45131, DE
E.ON SE (1EOAN) Earnings & Revenues
1EOAN Stock 12 Month Forecast
Average Price Target
Technical Analysis
Overall Consensus
| Indicator | Bullish | Neutral | Bearish |
|---|---|---|---|
| Overall Consensus | 12 | 6 | 4 |
| Technical Analysis | 3 | 6 | 1 |
| Moving Averages | 9 | 0 | 3 |
