


Carraro India Ltd. stock analysis
Want to see IN:CARRARO full AI Analyst Report?
Carraro India Ltd. (CARRARO) Stock Price & Analysis
CARRARO Stock Chart & Stats
- Day’s Range
- INR 489.00 - INR 499.90
- 52-Week Range
- INR 416.80 - INR 667.25
- Previous Close
- INR 489.00
- Volume
- N/A
- Average Volume (3M)
- 24.20K
- Market Cap
- INR 27.80B
- Enterprise Value
- INR 31.01B
- Total Cash (Recent Filing)
- INR 987.29M
- Total Debt (Recent Filing)
- INR 1.83B
- Price to Earnings (P/E)
- 20.6
- Beta
- 1.49
- Next Earnings
- Feb 14, 2027 (Est.)
- EPS Estimate
- N/A
- Last Dividend Ex-Date
- Sep 03, 2026
- Dividend Yield
- 1.37%
Bulls Say, Bears Say
Bulls Say
Revenue And Earnings Growth
Rapid revenue acceleration combined with higher net income indicates stronger demand and operating scale in Carraro India's drivetrain business. If sustained, this growth can broaden the earnings base, support reinvestment, and strengthen the company's position with agricultural and construction equipment OEMs.
Strengthening Balance Sheet
Rising equity and declining debt improve financial resilience as the company expands. This provides greater capacity to fund production and working-capital needs internally, reduces leverage pressure, and gives management more flexibility to pursue durable growth through the equipment cycle.
Improving Cash Generation
Higher operating and free cash flow show that strong reported growth is increasingly translating into cash resources. Better cash generation can support investment, debt reduction, and shareholder returns, while improving the company's ability to withstand normal fluctuations in OEM demand.
Bears Say
Potential Gross-margin Pressure
The implied gross-margin decline suggests that rapid revenue growth may be accompanied by less favorable mix or higher production costs. Unless addressed through pricing, localization, or efficiency, sustained margin pressure could limit earnings conversion and reduce the benefit of expanding sales.
Uneven Cash Conversion
Weak cash conversion in FY2025 indicates that profits can be absorbed by working-capital requirements or reinvestment. This creates volatility in internally generated funding, potentially increasing reliance on debt or external capital when the business is growing rapidly or demand conditions soften.
Exposure To Equipment Cycles
Dependence on tractor and construction-equipment volumes exposes Carraro India to structural swings in its end markets. A weaker equipment cycle could reduce OEM orders and capacity utilization, making revenue and margins less predictable even if the company's drivetrain technology and customer relationships remain intact.
Carraro India Ltd. News




CARRARO FAQ
What was Carraro India Ltd.’s price range in the past 12 months?
What is Carraro India Ltd.’s market cap?
When is Carraro India Ltd.’s upcoming earnings report date?
How were Carraro India Ltd.’s earnings last quarter?
Is Carraro India Ltd. overvalued?
Does Carraro India Ltd. pay dividends?
What is Carraro India Ltd.’s EPS estimate?
How many shares outstanding does Carraro India Ltd. have?
What happened to Carraro India Ltd.’s price movement after its last earnings report?
Which hedge fund is a major shareholder of Carraro India Ltd.?
What is the TipRanks Smart Score and how is it calculated?
Company Description
Carraro India Ltd.
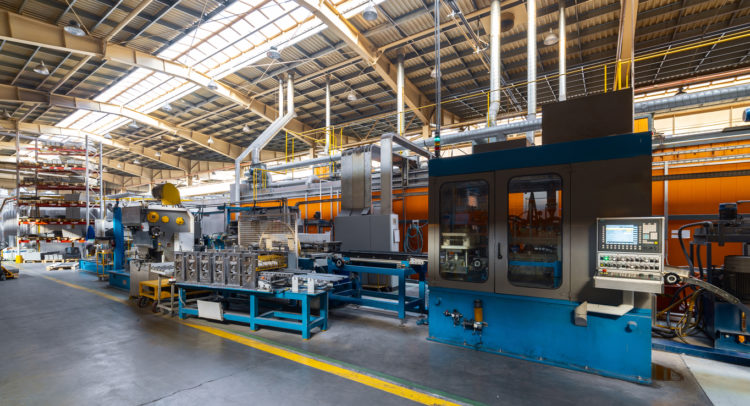
Established in 1997 and headquartered in Pune, India, Carraro India Limited specializes in the production and global distribution of a wide array of automotive and industrial components, alongside heavy equipment. The company supplies critical parts for agricultural machinery, including mechanical transmissions, clutches, hydraulic lifts, planetary drives, and axles. For the construction industry, their offerings encompass not only associated components and spare parts but also various machinery such as backhoe loaders, soil compactors, cranes, self-loading concrete mixers, and compact motor graders. Furthermore, Carraro India manufactures precision gears, shafts, and ring gears, catering to diverse industrial, automotive, and material handling applications. The firm operates as a subsidiary of Carraro International S.E.
- Sector
- General
- Industry
- Auto - Parts
- CEO
- Balaji Gopalan
- Employees
- 908
- Website
- www.carraroindia.com
- Address
- B2/2 MIDC, Ranjangaon, Pune, MA, 412220, IN
Carraro India Ltd. (CARRARO) Earnings & Revenues
Technical Analysis
Overall Consensus
| Indicator | Bullish | Neutral | Bearish |
|---|---|---|---|
| Overall Consensus | 9 | 5 | 8 |
| Technical Analysis | 4 | 5 | 1 |
| Moving Averages | 5 | 0 | 7 |
Similar Stocks
| Company | Price & Change | Follow |
|---|---|---|
| IN:AUTOAXLESAutomotive Axles Limited | ||
| IN:DIVGIITTSDivgi TorqTransfer Systems Ltd. | ||
| IN:GNAGNA Axles Ltd | ||
| IN:JTEKTINDIAJTEKT India Limited | ||
| IN:RACLGEARRACL Geartech Ltd |
