


illumin Holdings earnings date
illumin Holdings (ILLMF) Q2 2026 Earnings Report
ILLMF Q2 2026 EPS Results
- Actual EPS
- $0.00
- Consensus EPS
- -$0.06
- Beat/Miss
- Beat by +$0.06
- One Year Ago EPS
- -$0.08
ILLMF Q2 2026 Revenue Results
- Actual Revenue
- $35.38M
- Expected Revenue
- $24.49M
- Beat/Miss
- Beat by +$10.89M
- YoY Revenue Growth
- +51.57%
Earnings Announcement Details
- Quarter
- Q2 2026
- Date
- 08/06/2026
- Time
- Before Open
- Conference Call
- Thursday, August 6, 2026
illumin Holdings's next earnings date is estimated for March 11, 2027, based on past reporting schedules.
Q2 2026 Earnings Call Audio
No earnings call audio is available for this earnings event.
Q2 2026 Earnings Slide Deck
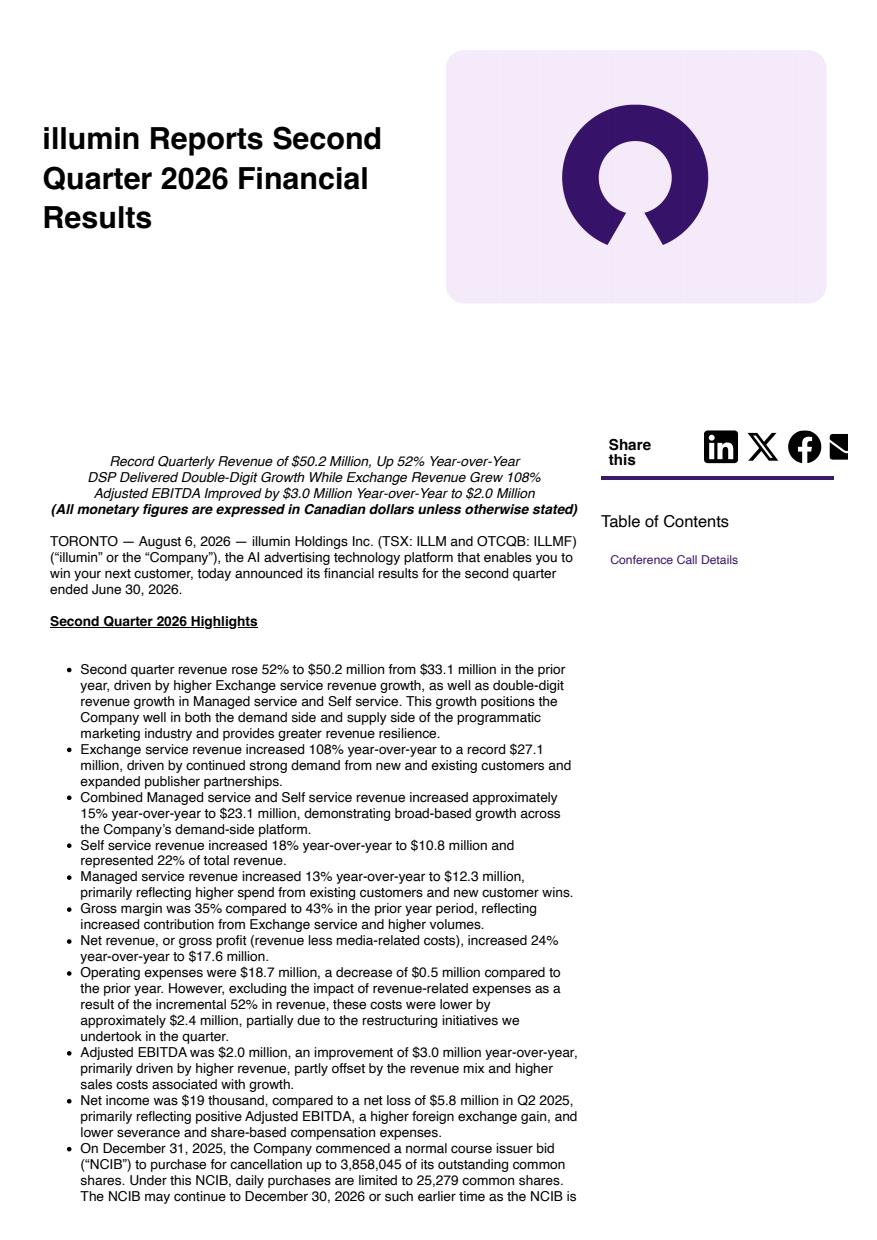
Q2 2026 Earnings Call Summary
The call conveyed a largely positive tone driven by a very strong quarter for the exchange (+108% YoY), a meaningful DSP recovery (+15% YoY), OpEx savings and early proof that deterministic data partnerships improve advertiser ROI. However, there are clear challenges: DSP growth is still below historical targets, several low-margin accounts constrain gross margins (management expects only gradual improvement of ~2–3 points), growth is coming from medium-sized customers rather than large accounts, and market valuation uncertainty complicates M&A timing. On balance, the momentum and operational improvements discussed outweigh the near-term challenges.
Management's guidance pointed to modest margin and revenue improvement: they expect to tack on "a few points" to gross margin (roughly 2–3 percentage points) over the year, are driving DSP recovery (DSP revenue grew 15% YoY in Q2 after a prior-year decline and management targets a return to historical 20–30% growth rates), are seeing outsized exchange momentum (exchange revenue up 108% YoY in Q2), and plan to sustain revenue growth without major incremental sales & marketing headcount by improving salesperson productivity; early-Q2 OpEx cuts produced savings (partially offset by higher variable OpEx such as sales commissions), and M&A outreach targets companies with roughly $10M–$300M in revenue amid generally lower market valuations.
- Exchange Revenue SurgeExchange revenue grew 108% year-over-year, driven by onboarding higher-quality publishers and more supply-demand partners; business development and improved inventory quality were cited as primary demand drivers.
- DSP Revenue RecoveryDSP revenue grew 15% year-over-year after a prior-year decline; management attributes recovery to product improvements, new partnerships, improved sales/marketing execution and moving upstream to larger clients.
- Profitability and OpEx SavingsCompany implemented OpEx cuts in early Q2 resulting in noticeable expense savings and contributed to bringing profitability to the bottom line; variable OpEx rose with commissions tied to higher revenue.
- Partnerships Delivering Better ROITwo strategic partnerships highlighted: a built-in brand-lift measurement solution, and a deal with Audience Acuity providing deterministic data. Early testing of deterministic data shows materially better ROI for advertisers versus probabilistic models.
- Gross Margin Improvement PlanManagement expects to improve gross margins by a few points (targeting roughly 2-3 percentage points) through removing or renegotiating low-margin accounts and prioritizing higher-margin business.
- Active M&A Outreach and PipelineCompany engaged an investment banker and has begun outreach; potential targets span ~$10M to ~$300M in revenue, indicating an active pipeline and opportunistic posture given current lower market valuations.
ILLMF Earnings History
| Report Date | Fiscal Quarter | Forecast / EPS | Last Year's EPS | EPS YoY Change | Press Release |
|---|---|---|---|---|---|
| Mar 11, 2027 | 2026 (Q4) | -0.03- | -0.06 | ― | ― |
| Nov 05, 2026 | 2026 (Q3) | -0.03-0.02 | -0.03 | 25.00% (+0.01) | |
| Aug 06, 2026 | 2026 (Q2) | -0.060.00 | -0.08 | 100.00% (+0.08) | |
| May 08, 2026 | 2026 (Q1) | -0.05-0.04 | -0.03 | -50.00% (-0.01) | |
| Mar 13, 2026 | 2025 (Q4) | 0.01-0.06 | 0.06 | -212.50% (-0.12) | |
| Nov 07, 2025 | 2025 (Q3) | 0.01-0.03 | -0.01 | -100.00% (-0.01) | |
| Aug 07, 2025 | 2025 (Q2) | -0.02-0.08 | -0.01 | -450.00% (-0.06) | |
| May 09, 2025 | 2025 (Q1) | -0.02-0.03 | -0.01 | -100.00% (-0.01) | |
| Mar 14, 2025 | 2024 (Q4) | 0.020.06 | -0.04 | 260.00% (+0.09) | |
| Nov 08, 2024 | 2024 (Q3) | -0.01-0.01 | 0.01 | -300.00% (-0.02) |
The table shows recent earnings report dates and whether the forecast was beat or missed. See the change in forecast and EPS from the previous year.
