


Kamada earnings date
Want to see IL:KMDA full AI Analyst Report?
Kamada (KMDA) Q3 2026 Earnings Report
IL:KMDA Q3 2026 EPS Results
- Actual EPS
- ILA 51.46
- Consensus EPS
- ILA 42.23
- Beat/Miss
- Beat by +ILA 9.24
- One Year Ago EPS
- ILA 30.35
IL:KMDA Q3 2026 Revenue Results
- Actual Revenue
- ILA 15.71B
- Expected Revenue
- ILA 17.32B
- Beat/Miss
- Missed by -ILA 1.61B
- YoY Revenue Growth
- -0.60%
Earnings Announcement Details
- Quarter
- Q3 2026
- Date
- 11/09/2026
- Time
- Before Open
- Conference Call
- Monday, November 9, 2026
Kamada's next earnings date is estimated for March 17, 2027, based on past reporting schedules.
Q3 2026 Earnings Call Audio
No earnings call audio is available for this earnings event.
Q3 2026 Earnings Slide Deck
Q3 2026 Earnings Call Summary
The call was strongly positive, characterized by record nine-month revenue, double-digit growth in revenue and profitability, raised 2026 guidance, expectations for continued double-digit growth in 2027, expanding demand across the commercial portfolio, new biosimilar launches, and a significant plasma supply agreement. The principal negatives were the nine-month gross-margin decline, higher operating expenses supporting expanded operations, cash and short-term investments being slightly below year-end 2025, plasma operations not yet contributing to reported results, and the absence of a completed M&A transaction. Highlights significantly outweighed lowlights.
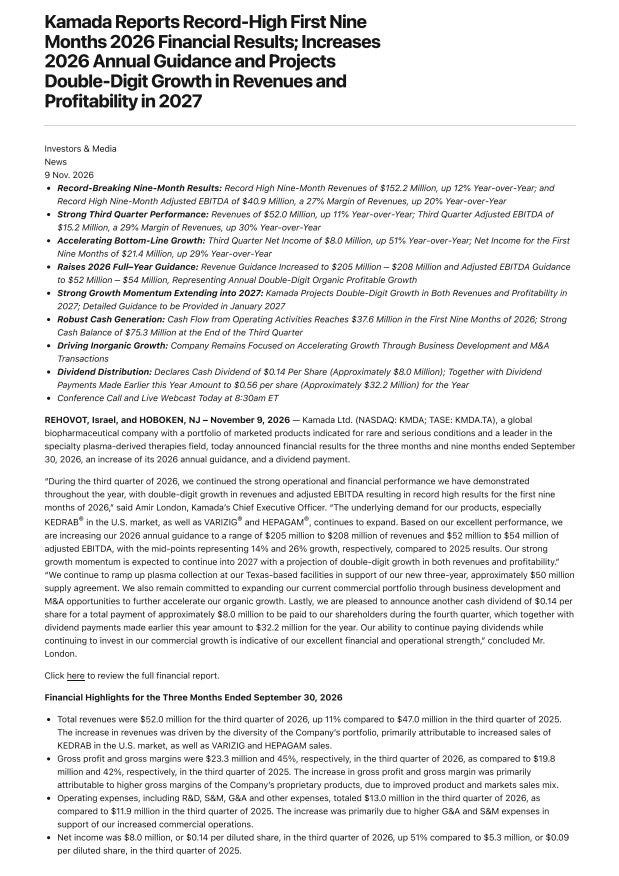
Kamada increased 2026 annual guidance to a range of $205 million to $208 million in revenues and $52 million to $54 million of adjusted EBITDA, with the midpoints representing 14% and 26% growth, respectively, compared to 2025 results; it projects continued double-digit profitable growth during 2027, with detailed financial guidance for 2027 provided in January. The biosimilar portfolio is expected to generate approximately $10 million in annual revenues in 2028, growing to approximately $20 million to $25 million in annual revenues by 2030, with at least 2 additional biosimilar products expected to launch next year; initial commercial sales under the 3-year sales agreement of approximately $50 million are included in current annual guidance.
- Record Nine-Month Revenue and Strong Profitability GrowthNine-month 2026 revenue reached a record $152.2 million, up approximately 12% year-over-year. Adjusted EBITDA was $40.9 million, up 20% year-over-year with a 27% margin, while net income was $21.4 million, up 29% year-over-year.
- Strong Third-Quarter Financial PerformanceThird-quarter 2026 revenue was $52 million, up 11% compared with the third quarter of 2025. Net income was $8 million, or $0.14 per diluted share, up 51% year-over-year. Adjusted EBITDA was $15.2 million, up 30%, representing a 29% revenue margin.
- Raised 2026 GuidanceThe company increased 2026 guidance to revenue of $205 million to $208 million and adjusted EBITDA of $52 million to $54 million. The guidance midpoints represent 14% and 26% growth, respectively, compared with 2025 results.
- Double-Digit Profitable Growth Expected in 2027Management projected another year of double-digit growth in revenues and profitability during 2027, with detailed 2027 financial guidance expected in January.
- Growing Demand Across Commercial PortfolioManagement said underlying demand continues to expand for its products, especially KEDRAB in the U.S. market, as well as VARIZIG and HEPAGAM B. Nine-month revenue growth was primarily attributable to increased sales of KEDRAB, VARIZIG, and HEPAGAM B, together with growth in the distribution segment.
- KEDRAB Demand and Supply CapacityU.S. KEDRAB demand continues to grow significantly, with management believing the product has at least 50% market share. Supply to distributor Kedrion is increasing year-over-year and is above the agreement's minimum commitment. Kamada said it has sufficient inventory and manufacturing capacity to support increased demand, including demand following the CDC health advisory. The current Kedrion agreement runs through the end of 2031.
- International Rabies Product GrowthKAMRAB sales continue to grow in Canada, Latin America, and Israel, and management also reported greater demand for KEDRAB or KAMRAB in those markets. Management highlighted that only three products meet FDA or EMA standards and cited the company's pediatric on-label study, supply-chain robustness, and additional plasma collection as product advantages.
- GLASSIA Expansion in Ex-U.S. MarketsGLASSIA revenue contribution is advancing through growing sales in Argentina, Russia, Switzerland, Israel, and additional markets primarily in Latin America, along with income from Takeda's sales of the product in the U.S. and Canada.
- CYTOGAM Post-Marketing Research ProgramKamada continues to support the comprehensive post-marketing research program for CYTOGAM, launched in the prior year, to help demonstrate the product's advantages in the prevention and management of CMV disease.
- Distribution Segment GrowthDistribution-segment revenue increased 35% year-over-year to $24.1 million. Growth was supported by the launch of additional biosimilars in Israel, expansion into the MENA region, new distribution agreements, additional product registrations, and increased market share for existing products in Israel.
- New Biosimilar Product LaunchesKamada commercially launched Ustekinumab-Kamada, a biosimilar to Stelara, and Enoxaparin-Kamada, a biosimilar to Clexane, in Israel during the third quarter. The company expects to launch at least two additional biosimilar products in 2027, in addition to other launches that have not been publicly disclosed.
- Biosimilar Revenue TargetsManagement expects the biosimilar portfolio to generate approximately $10 million in annual revenue in 2028 and approximately $20 million to $25 million in annual revenue by 2030.
- Plasma Collection AgreementKamada announced a three-year sales agreement worth approximately $50 million to supply normal source plasma to a leading biopharmaceutical company focused on plasma-derived therapy. Initial commercial sales under the agreement are scheduled to be recorded in the current quarter and were included in the current annual guidance.
- Vertical Integration and Plasma CapacityManagement said the plasma agreement validates its U.S.-based plasma collection centers, vertical integration strategy, and multi-year revenue growth objectives. The company also said additional plasma collection is expected to support its rabies products and other specialty plasma operations.
- Improved Gross Profit in the Third QuarterThird-quarter gross profit was $23.3 million with a 45% gross margin. Management attributed the increase in gross profit and gross margins primarily to higher margins on proprietary products resulting from improved product and market sales mix.
- Higher Operating Cash FlowCash provided by operating activities was approximately $37.6 million in the first nine months of 2026, compared with $17.9 million in the first nine months of 2025.
- Shareholder Returns While Maintaining CashKamada announced another $0.14-per-share cash dividend, representing approximately $8 million to be paid during the fourth quarter. Including $24.2 million paid earlier in the year, total 2026 dividends are expected to be approximately $32.3 million. Management said it can continue paying dividends while maintaining a strong cash position and investing in commercial growth.
- Four-Pillar Growth StrategyManagement reiterated its four strategic growth drivers: organic growth of the commercial portfolio, expansion of the distribution and in-licensing business, growth of the plasma collection operation, and business development and M&A activity.
- Existing Portfolio Driving Current GrowthManagement stated that the significant growth currently being experienced is driven solely by the existing commercial product portfolio. The company expects growth to accelerate further after executing acquisitions and other M&A transactions pursued under its strategic plan.
- Business Development PipelineKamada said business development and M&A remain a core focus, that it is screening and conducting due diligence on opportunities, and that it has opportunities under review with the expectation of potentially having news to report in the near term.
IL:KMDA Earnings History
| Report Date | Fiscal Quarter | Forecast / EPS | Last Year's EPS | EPS YoY Change | Press Release |
|---|---|---|---|---|---|
| Mar 17, 2027 | 2026 (Q4) | 36.29- | 22.43 | ― | ― |
| Nov 09, 2026 | 2026 (Q3) | 42.2351.46 | 30.35 | 69.57% (+21.11) | |
| Aug 12, 2026 | 2026 (Q2) | 36.9556.74 | 43.55 | 30.30% (+13.20) | |
| May 13, 2026 | 2026 (Q1) | 37.9427.71 | 24.08 | 15.07% (+3.63) | |
| Mar 11, 2026 | 2025 (Q4) | 25.7322.43 | 24.08 | -6.85% (-1.65) | |
| Nov 10, 2025 | 2025 (Q3) | 30.3530.35 | 24.41 | 24.32% (+5.94) | |
| Aug 13, 2025 | 2025 (Q2) | 29.6943.55 | 27.71 | 57.14% (+15.83) | |
| May 14, 2025 | 2025 (Q1) | 22.4324.08 | 14.52 | 65.91% (+9.57) | |
| Mar 05, 2025 | 2024 (Q4) | 17.4824.08 | 32 | -24.74% (-7.92) | |
| Nov 13, 2024 | 2024 (Q3) | 22.1024.41 | 21.77 | 12.12% (+2.64) |
The table shows recent earnings report dates and whether the forecast was beat or missed. See the change in forecast and EPS from the previous year.
