

Graincorp Limited Class A (GRCLF) Q2 2026 Earnings Report
GRCLF Q2 2026 EPS Results
- Actual EPS
- $0.01
- Consensus EPS
- $0.22
- Beat/Miss
- Missed by -$0.21
- One Year Ago EPS
- $0.18
GRCLF Q2 2026 Revenue Results
- Actual Revenue
- $2.72B
- Expected Revenue
- $2.87B
- Beat/Miss
- Missed by -$146.98M
- YoY Revenue Growth
- -5.13%
Earnings Announcement Details
- Quarter
- Q2 2026
- Date
- 05/13/2026
- Time
- After Close
- Conference Call
- Wednesday, May 13, 2026
Graincorp Limited Class A's next earnings date is estimated for November 12, 2026, based on past reporting schedules.
Q2 2026 Earnings Call Audio
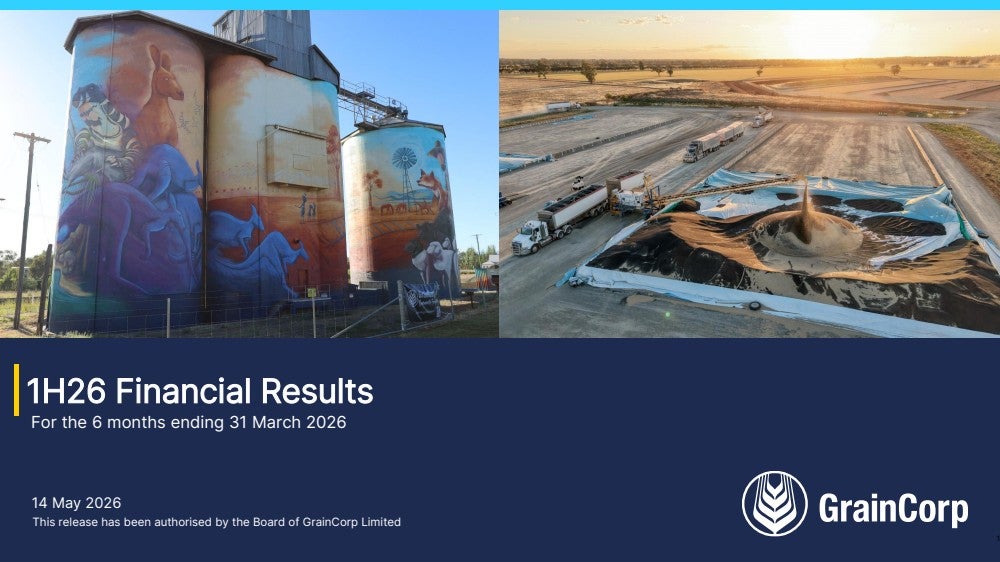
Q2 2026 Earnings Slide Deck
Q2 2026 Earnings Call Summary
The call presented a balanced picture: strong operational execution (H1 underlying EBITDA $136M), continued dividend and portfolio optimisation, progress on transformation and sustainability initiatives, and clear capital discipline. However, cyclical headwinds — notably a global grain oversupply compressing margins, mark-to-market derivative effects in nutrition & energy, lower agri-energy demand and one-off exit and transformation costs — meaningfully constrained reported results. Management reiterated FY26 guidance and emphasised confidence in through-the-cycle earnings and transformation savings, but several near-term timing and commodity-market risks remain.
GrainCorp reaffirmed FY‑26 guidance of underlying EBITDA $200–240m and underlying NPAT $20–50m after reporting H1 underlying EBITDA of $136m and core cash of $163m, and the Board declared an ordinary fully‑franked interim dividend of $0.14 per share; full‑year CapEx is guided to $85–90m (H1 CapEx $30m, sustaining $15m). Management expects a normal net‑working‑capital unwind into H2, FY‑26 crush margins broadly in line with FY‑25 (H1 mark‑to‑market derivative losses expected to unwind in H2), and reiterated transformation targets of $5–10m run‑rate exit savings in FY‑26 and $20–30m EBITDA uplift on completion (H1 Transformation OpEx $17m); other H1 items included an estimated $16m loss on the GrainsConnect Canada exit. Key operational metrics cited were 277,000 t canola crushed, 3.3m t exported via ports (vs 3.2m pcp), 1.5m t bulk materials handled (up from 1.2m), 390,000 t animal nutrition sales (up from 370,000) and 26.5m t total grain handled, with management noting through‑the‑cycle earnings of ~$320m.
- Solid Half-Year Underlying EBITDAReported underlying EBITDA of $136 million for H1 FY26 and the Board reaffirmed FY26 guidance of $200–$240 million underlying EBITDA and underlying NPAT of $20–$50 million.
- Shareholder Returns MaintainedBoard declared an ordinary interim dividend of $0.14 per share, fully franked, continuing GrainCorp's track record of capital returns.
- Operational Volume Strengths — Ports and Bulk MaterialsPorts exports executed 3.3 million tonnes in the half (up from 3.2 million prior year, ≈+3.1%) and bulk materials handled increased from 1.2 million to 1.5 million tonnes (+25%), demonstrating strong utilization of port assets and diversification of revenue streams.
- Animal Nutrition Record SalesAnimal nutrition posted record sales of 390,000 tonnes, up from 370,000 tonnes year-on-year (≈+5%), supported by larger herd sizes in Australia and strong dairy demand in New Zealand.
- Stable Oilseed Crush VolumesCanola crush volumes remained strong at 277,000 tonnes in H1, broadly in line with the prior half-year, with management expecting FY26 crush margins to be broadly in line with FY25 once timing effects unwind.
- Balance Sheet and Cash PositionCore cash of $163 million at half-year, a strong balance sheet according to management, with net working capital at seasonal peak and expected to unwind in H2; interest expense was lower due to lower commodity volumes and values.
- Transformation Program Delivering SavingsBusiness transformation (Release 1) OpEx of $17 million in the half; management confirms run-rate exit savings from FY26 of $5–$10 million and expected EBITDA uplift of $20–$30 million on a through-the-cycle basis as program completes.
- Sustainability and Innovation ProgressCommitted to the Science Based Targets initiative, joined the Climate Leaders Coalition, published first annual progress report (Scope 1 & 2 emissions down 4.3% vs 2022 baseline) and expanded GrainCorp Next and BioScout deployments.
- Portfolio Actions and Capital DisciplineSigned sale of 50% stake in GrainsConnect Canada (transaction nearing completion in H2 FY26) as part of ongoing portfolio optimisation; full-year CapEx guidance maintained at $85–$90 million.
GRCLF Earnings History
| Report Date | Fiscal Quarter | Forecast / EPS | Last Year's EPS | EPS YoY Change | Press Release |
|---|---|---|---|---|---|
| Nov 12, 2026 | 2026 (Q4) | -0.02- | 0.05 | ― | ― |
| May 13, 2026 | 2026 (Q2) | 0.220.01 | 0.18 | -91.95% (-0.17) | |
| Nov 12, 2025 | 2025 (Q4) | 0.060.05 | 0.06 | -19.57% (-0.01) | |
| May 14, 2025 | 2025 (Q2) | 0.180.18 | 0.15 | 18.64% (+0.03) | |
| Nov 13, 2024 | 2024 (Q4) | 0.080.06 | 0.2 | -67.83% (-0.14) | |
| May 15, 2024 | 2024 (Q2) | 0.180.15 | 0.63 | -75.34% (-0.47) | |
| Nov 15, 2023 | 2023 (Q4) | 0.210.20 | 0.41 | -51.44% (-0.21) | |
| May 10, 2023 | 2023 (Q2) | 0.390.63 | 0.75 | -16.71% (-0.13) | |
| Nov 15, 2022 | 2022 (Q4) | 0.590.41 | 0.27 | 52.20% (+0.14) | |
| May 11, 2022 | 2022 (Q2) | 0.800.75 | 0.15 | 386.82% (+0.60) |
The table shows recent earnings report dates and whether the forecast was beat or missed. See the change in forecast and EPS from the previous year.