


Dollar Tree stock analysis
Dollar Tree (0IC8) Share Price & Analysis
0IC8 Stock Chart & Stats
- Day’s Range
- $138.78 - $142.62
- 52-Week Range
- $86.08 - $149.04
- Previous Close
- $139.81
- Volume
- N/A
- Average Volume (3M)
- 804
- Market Cap
- $26.42B
- Enterprise Value
- $30.90B
- Total Cash (Recent Filing)
- $1.06B
- Total Debt (Recent Filing)
- $7.67B
- Price to Earnings (P/E)
- 17.4
- Beta
- 0.96
- Next Earnings
- Nov 24, 2026 (Est.)
- EPS Estimate
- 0.91
- Last Dividend Ex-Date
- Mar 15, 2022
- Dividend Yield
- N/A
Bulls Say, Bears Say
Bulls Say
Improved Store Execution
Improving store conditions, in-stock levels, shoppability and planning can support repeat visits and better sales productivity across a large fleet. The reduction in underperforming stores indicates that operational initiatives are gaining traction, although further execution remains important.
Strong Cash Generation
Strong operating and free cash flow gives Dollar Tree capacity to fund store investments, refreshes and other strategic initiatives while supporting shareholder returns. Favorable free-cash-flow growth also provides resilience as the company works through its broader operational recovery.
Multi-Price Format Adoption
Greater multi-price adoption expands Dollar Tree’s flexibility to match assortment and pricing with customer demand while preserving its value proposition. Over time, this format can support more relevant merchandise, larger baskets and improved economics across the store base.
Bears Say
Elevated Leverage
Elevated leverage leaves less financial flexibility if retail conditions weaken or investment needs rise. It can also constrain capital allocation and increase sensitivity to earnings volatility, even though total debt has declined from earlier highs and recent returns have improved.
Unstable Earnings History
The swing from losses in 2024 and 2025 to recent profitability shows that the recovery is not yet fully proven through a stable cycle. Earnings volatility can make planning and reinvestment more difficult and leaves less margin for execution missteps.
Back-Half Margin Pressure
Higher fuel-driven freight costs, merchandise inflation and a greater consumables mix are expected to pressure margins in the second half. Persistent cost pressure could limit how much of the sales recovery converts into durable operating profit.
Dollar Tree News









0IC8 FAQ
What was Dollar Tree’s price range in the past 12 months?
What is Dollar Tree’s market cap?
When is Dollar Tree’s upcoming earnings report date?
How were Dollar Tree’s earnings last quarter?
Is Dollar Tree overvalued?
Does Dollar Tree pay dividends?
What is Dollar Tree’s EPS estimate?
How many shares outstanding does Dollar Tree have?
What happened to Dollar Tree’s price movement after its last earnings report?
Which hedge fund is a major shareholder of Dollar Tree?
What is the TipRanks Smart Score and how is it calculated?
Dollar Tree Stock Smart Score
Company Description
Dollar Tree
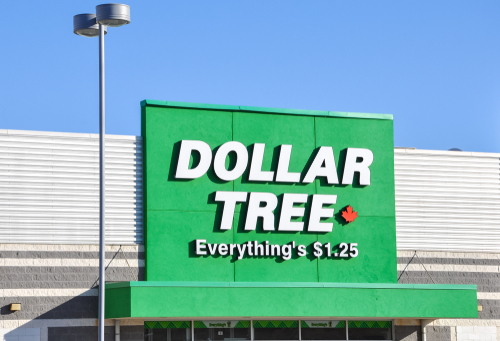
Dollar Tree, Inc. (DLTR) operates as a leading discount retailer, managing its extensive operations through two principal divisions: Dollar Tree and Family Dollar. The Dollar Tree segment distinguishes itself by offering all its merchandise at a consistent price of $1.25. Its product range is broad, encompassing essential consumables like confectionery, various food items, health and personal care products, household cleaning chemicals, paper goods, and frozen or refrigerated foods. Beyond these daily necessities, customers can find a diverse selection of general merchandise, including toys, resilient housewares, gifts, stationery, party essentials, greeting cards, softline apparel, and arts and crafts supplies. The segment also prominently features seasonal items for holidays such as Christmas, Easter, Halloween, and Valentine's Day. By January 29, 2022, this division maintained a substantial presence with 8,061 retail locations across its Dollar Tree and Dollar Tree Canada brands, supported by 15 distribution centers in the U.S. and an additional two in Canada. Conversely, the Family Dollar segment functions as a general merchandise discount chain with varying prices. Its inventory is comprehensive, covering a wide array of consumable goods such as groceries, beverages, tobacco, personal care and health products, household chemicals, paper products, hardware, automotive accessories, diapers, batteries, and pet food and supplies. Additionally, the segment provides home products, which include housewares, home décor, giftware, and domestics like bedding and towels. Shoppers can also find apparel and accessories, encompassing clothing, fashion items, and footwear. Seasonal and electronics merchandise, ranging from holiday-specific goods to pre-paid cellular phones and services, along with stationery, school supplies, and toys, are also key offerings. As of January 29, 2022, the Family Dollar brand operated 8,016 stores and was supported by 11 distribution centers. Founded in 1986, Dollar Tree, Inc. is headquartered in Chesapeake, Virginia.
- Sector
- Consumerdefensive
- Industry
- Discount Stores
- CEO
- Michael C. Creedon Jr.
- Employees
- 150,000
- Website
- www.dollartree.com
- Address
- 500 Volvo Parkway, Chesapeake, VA, 23320, US
Dollar Tree (0IC8) Earnings & Revenues
0IC8 Company Deck
0IC8 Earnings Call
Earnings Call SentimentPositive
The call was strongly positive overall. Management reported better-than-expected sales, positive traffic, broad-based category strength, improved store execution, favorable shrink, strong cash flow and raised full-year EPS guidance. The principal challenges were helium supply constraints, inflation, fuel-driven freight costs, expected back-half gross-margin pressure, ongoing tariff uncertainty and remaining store-execution opportunities, but management expressed confidence in the underlying business momentum and long-term strategy.
View all GB:0IC8 earnings summaries0IC8 Net sales Breakdown
- 100.00% Dollar Tree
- 0.00% Corporate, Support and Other

0IC8 Stock 12 Month Forecast
Average Price Target
Technical Analysis
Overall Consensus
| Indicator | Bullish | Neutral | Bearish |
|---|---|---|---|
| Overall Consensus | 15 | 5 | 2 |
| Technical Analysis | 3 | 5 | 2 |
| Moving Averages | 12 | 0 | 0 |
