


FrontView REIT, Inc. earnings date
Want to see FVR full AI Analyst Report?
FrontView REIT, Inc. (FVR) Q3 2026 Earnings Report
FVR Q3 2026 EPS Results
- Actual EPS
- $0.08
- Consensus EPS
- -$0.02
- Beat/Miss
- Beat by +$0.10
- One Year Ago EPS
- $0.19
FVR Q3 2026 Revenue Results
- Actual Revenue
- $18.63M
- Expected Revenue
- $18.67M
- Beat/Miss
- Missed by -$44.00K
- YoY Revenue Growth
- +10.86%
Earnings Announcement Details
- Quarter
- Q3 2026
- Date
- 11/04/2026
- Time
- After Close
- Conference Call
- Wednesday, November 4, 2026
FrontView REIT, Inc.'s next earnings date is estimated for March 24, 2027, based on past reporting schedules.
Q3 2026 Earnings Call Audio
Q3 2026 Earnings Slide Deck
Q3 2026 Earnings Call Summary
The call was strongly positive. Management reported 19% growth in annualized base rent, occupancy of 99.4%, lower leverage, positive acquisition and disposition spreads, improving property-level expenses, strong lease recapture and a well-funded acquisition pipeline. The main negatives were lower episodic income, somewhat higher G&A relative to peers, shorter lease terms on selected acquisitions and near-term per-share dilution from equity and preferred financing, but management framed these issues as manageable or connected to growth.
FrontView maintained 2026 AFFO guidance of $1.32 to $1.34 per share, representing approximately 7% growth at the midpoint, with fourth-quarter guidance of $0.33 per share and no other income assumed; full year cash G&A is expected to be approximately $10.5 million, excluding nonrecurring expenses, and percentage rent is expected to have a run rate close to $50,000 quarterly, while mortgage interest income in the fourth quarter will decrease to $196,000. The company is well positioned to meet or exceed full year net investment guidance of approximately $120 million, with over $40 million under LOI or purchase and sale agreement at yields above those achieved in the third quarter, and expects approximately $50 million of dispositions for the rest of the year. Pro forma for the final preferred draw, leverage declines to 4.5x, allowing the company to fund an additional $80 million of net investment in 2027 while maintaining leverage at or below 5.5x; repeating approximately $120 million of net investment in 2027 would result in leverage close to 5.8x, within the targeted range of 5x to 6x. Contractual escalators and below-market rents are expected to drive 1.5% to 2% of annual organic growth, retained and reinvested free cash flow is expected to add approximately 3% to annual growth, and combined structural growth is 4.5% to 5%.
- Portfolio Growth and Occupancy ImprovementSince the first quarter as a public company, annualized base rent increased 19% to $69.8 million, the portfolio grew from 307 to 327 properties, and occupancy increased from 97.7% to 99.4%.
- Improved Portfolio DiversificationCasual dining tenancies declined from 15.6% of rent to 9.1%, while Texas and Florida exposure increased from 11.6% to 17.8%. Verizon is the largest tenant at only 2.5% of rent, and the top 10 tenants represent 20.1% of rent.
- Lower Leverage and Strong Balance SheetNet debt to adjusted annualized EBITDA declined from 5.5x to 5.0x, or 4.5x including the undrawn preferred. During the year, leverage declined from 5.6x to 5.0x at quarter end and to 4.5x pro forma for the final preferred draw, below the targeted 5x to 6x range.
- Value Creation Through Asset ManagementAcross six highlighted tenant outcomes, estimated site value increased to approximately $29 million versus a combined purchase price of about $19 million, representing nearly 53% value creation. New leases have averaged over 117% of prior rents.
- Successful Re-Leasing and Rent GrowthThe Winston-Salem site was re-leased after Twin Peaks' bankruptcy to Panda Express and Jaggers at a 92% increase in rent. A Stone Mountain, Georgia Wendy's site received a 15-year Chase ground lease beginning after Wendy's expiration at a 53% increase in rent.
- Strong Disposition ResultsThe company sold five properties during the quarter for $17.1 million at a 6.56% cap rate. Since the IPO, it has sold 56 properties for $128 million, with 42 occupied properties sold at a 6.8% cap rate. Sales included properties sold at 150%, 120%, 131%, 191%, 120% and 113% of cost in the examples discussed.
- Positive Acquisition and Disposition SpreadSince the IPO, FrontView acquired 104 properties for $370 million at a 7.7% cap rate versus 42 occupied-property dispositions at a 6.8% cap rate, representing approximately a 90-basis-point positive spread. The company generated a 100-basis-point spread between acquisitions and dispositions in the third quarter.
- Third-Quarter Acquisition ActivityFrontView acquired 16 properties in the third quarter for $50.6 million at a 7.56% average cap rate, with a median purchase price of approximately $2.65 million and median rent of approximately $208,000.
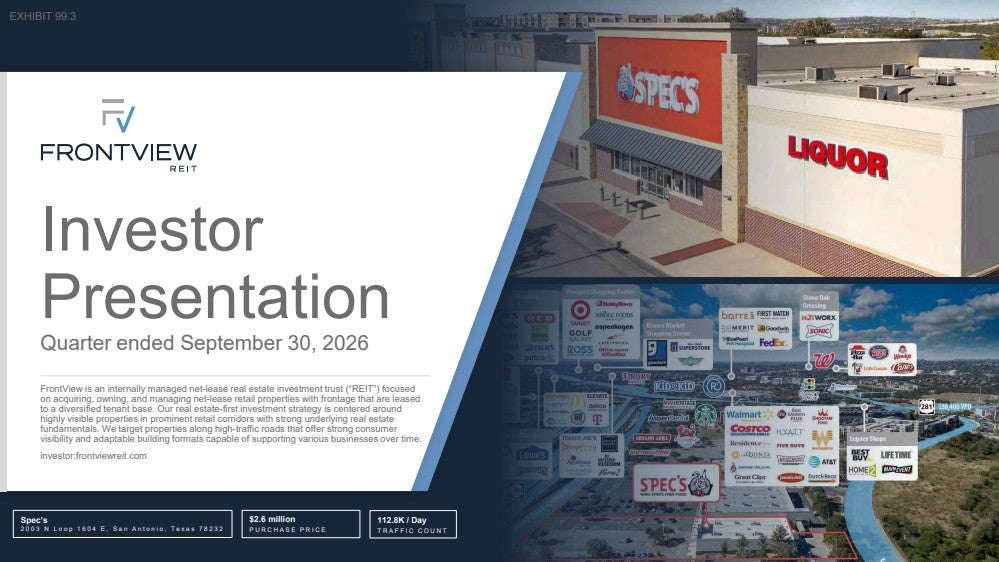
- Attractive Spec's AcquisitionThe company acquired a 20,000-square-foot Spec's property in San Antonio for $2.6 million, approximately 18% below the seller's asking price, at a 7.6% cap rate and $132 per square foot, roughly half of replacement cost. Spec's pays about $10 per square foot versus estimated submarket rents of about $20, and the company expects a 9.1% yield on cost at the second renewal option.
- Dallas Joint Venture InvestmentFrontView invested $2.7 million in a joint venture to re-tenant a well-located property near downtown Dallas with in-place rents significantly below market. The investment contributed $19,000 to AFFO in its first partial quarter, with management targeting a mid-to-high teens IRR and potentially more than 20% if rents exceed initial estimates.
- High Occupancy and Limited Credit Watch ExposureThe portfolio ended the quarter 99.4% occupied with only two vacancies. There were no new additions to the watch list, the 50-basis-point 2026 bad-debt placeholder remained largely unidentified, and the new Chase lease eliminated remaining Meritage exposure.
- Active Investment Pipeline and 2026 PlanMore than $40 million was under letter of intent or purchase and sale agreement at yields above those achieved in the third quarter. Depending on closing timing, management said the company is well positioned to meet or exceed full-year net investment guidance of approximately $120 million.
- Revenue and NOI GrowthContractual cash rents increased $777,000 sequentially to $16.7 million. Adjusted cash revenue increased 4.4% to $17.1 million, or 5.6% excluding other income, and adjusted cash NOI was $17.4 million. Exiting run-rate adjusted cash NOI was approximately $17.2 million.
- Lower Non-Reimbursable Property ExpensesNon-reimbursable property expenses declined to $216,000, or 1.3% of adjusted cash revenue, from $405,000, or 2.6% of cash revenue, a year earlier.
- Embedded Lease GrowthSix new leases represented $1.2 million of annualized rent, a 19.3% increase over the prior leases. Four leases commencing in the fourth quarter contribute $485,000 of annualized rent, while two leases commencing in 2027 add $699,000.
- Improved Capital and Liquidity MetricsFrontView ended the quarter with $174 million of liquidity. Since year-end, leverage declined from 34.5% to 30.6%, the AFFO payout ratio improved from approximately 69% to 64.7%, and fixed-charge coverage remained strong at 3.5x.
- Debt Maturity Extension and Interest-Rate HedgingThe revolver and term loan were extended to October 2028, with an option to extend to October 2029. The company has fixed swaps on $200 million of term debt at 3.66% and another $100 million of revolver debt at approximately 3%, producing a blended fixed SOFR rate of approximately 3.4% through March 2028.
- 2026 AFFO Guidance MaintainedThe company maintained 2026 AFFO guidance of $1.32 to $1.34 per share, representing approximately 7% growth at the midpoint. Fourth-quarter guidance is $0.33 per share with no other income assumed.
- Structural Growth FrameworkManagement said contractual escalators and below-market rents provide 1.5% to 2% of annual organic growth, while the low payout ratio allows retained and reinvested free cash flow to add approximately 3% of annual growth, for 4.5% to 5% growth before new capital deployment.
- Capacity to Fund Future GrowthManagement said current capacity allows the company to complete its 2026 investment plan and fund an additional $80 million of net investment in 2027 while maintaining leverage at or below 5.5x. Repeating approximately $120 million of net investment in 2027 would result in leverage of close to 5.8x, within the targeted range.
- Strong Renewal and Tenant PerformanceFor 2026 expirations, management reported a 116.4% recovery rate with three remaining items. Of approximately 34 leases representing 6.5% to 6.7% of ABR expiring in 2027, 10 were already complete, and management said it had visibility through the third quarter. Tenants were described as performing well, with rent coming in on time as expected.
- AI-Supported Scaling and SourcingManagement said it is using AI to process information, access tenant financials, run processes and source new transactions, and believes the technology can help the company scale despite its smaller size.
- Additional Development OpportunitiesThe company is evaluating a couple of development opportunities following the Dallas joint venture. These opportunities are expected to be risk mitigated through signed leases, entitlements, site-plan approval, zoning and general-contractor contracts, with management targeting a 100- to 200-basis-point spread.
- Leadership ExpansionThe Board appointed Pierre Revol as President in addition to his role as Chief Financial Officer, with management citing the strength of the leadership team and the company's commitment to scaling while preserving its entrepreneurial culture.
FVR Earnings History
| Report Date | Fiscal Quarter | Forecast / EPS | Last Year's EPS | EPS YoY Change | Press Release |
|---|---|---|---|---|---|
| Mar 24, 2027 | 2026 (Q4) | -0.03- | -0.19 | ― | ― |
| Nov 04, 2026 | 2026 (Q3) | -0.020.08 | 0.19 | -57.89% (-0.11) | |
| Aug 06, 2026 | 2026 (Q2) | 0.010.03 | -0.16 | 118.75% (+0.19) | |
| May 06, 2026 | 2026 (Q1) | -0.030.00 | -0.06 | 100.00% (+0.06) | |
| Feb 24, 2026 | 2025 (Q4) | -0.01-0.19 | -0.78 | 75.64% (+0.59) | |
| Nov 12, 2025 | 2025 (Q3) | -0.050.19 | -0.06 | 416.67% (+0.25) | |
| Aug 13, 2025 | 2025 (Q2) | -0.02-0.16 | -0.4 | 60.00% (+0.24) | |
| May 14, 2025 | 2025 (Q1) | -0.02-0.06 | ― | ― | |
| Mar 19, 2025 | 2024 (Q4) | 0.01-0.78 | ― | ― | |
| Nov 13, 2024 | 2024 (Q3) | -0.17-0.06 | ― | ― |
The table shows recent earnings report dates and whether the forecast was beat or missed. See the change in forecast and EPS from the previous year.
