

Want to see FIS full AI Analyst Report?
Fidelity National Info (FIS) Q2 2026 Earnings Report
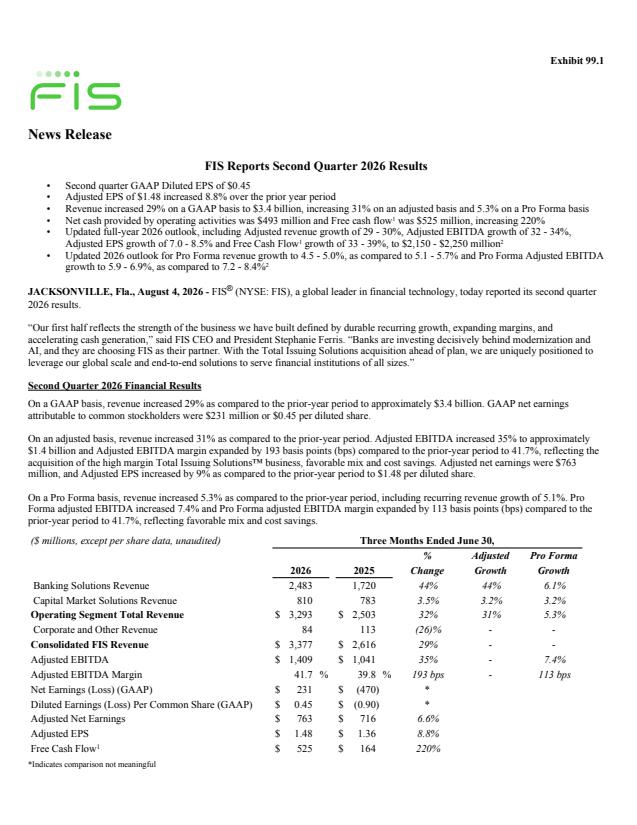
FIS Q2 2026 EPS Results
- Actual EPS
- $1.48
- Consensus EPS
- $1.47
- Beat/Miss
- Beat by +$0.01
- One Year Ago EPS
- $1.36
FIS Q2 2026 Revenue Results
- Actual Revenue
- $3.38B
- Expected Revenue
- $3.38B
- Beat/Miss
- Missed by -$7.00M
- YoY Revenue Growth
- +29.09%
Earnings Announcement Details
- Quarter
- Q2 2026
- Date
- 08/04/2026
- Time
- Before Open
- Conference Call
- Tuesday, August 4, 2026
Fidelity National Info's next earnings date is estimated for February 16, 2027, based on past reporting schedules.
Q2 2026 Earnings Call Audio
Q2 2026 Earnings Slide Deck
Q2 2026 Earnings Call Summary
The call conveyed a predominantly constructive picture: strong top-line and margin performance driven by Banking and Payments, a substantial improvement in free cash flow, successful integration and commercial traction from the Total Issuing Solutions acquisition, and early tangible AI-driven productivity gains. These positives were tempered by execution issues in Capital Markets—notably weaker professional services sales and slower backlog conversion—plus a rebase of Capital Markets guidance and a modest cut to company revenue guidance. Management has clear mitigation plans (strategic review, operational actions) and raised cash flow guidance, but near-term Capital Markets headwinds remain the principal negative.
Management updated 2026 guidance: full‑year adjusted revenue growth was lowered to 4.5–5.0% (from 5.1–5.7%), Banking guidance was reiterated while Capital Markets was rebased to 3.0–3.5% (a 225 bp cut, including ~120 bp from lower professional services), and full‑year adjusted EBITDA margin expansion is now expected at 85–105 bps (vs prior 95–110). Adjusted EPS is guided to grow 7.0–8.5% for the year, free cash flow was increased by $100M to $2.15–2.25B (~$2.2B midpoint, ~+36% YoY at midpoint) after Q2 FCF of $525M and ~ $1.0B YTD (trailing 12‑month FCF $2.2B), leverage is down to 3.5x, and non‑GAAP one‑time cash costs were reduced by $70M to a $730M midpoint. Near‑term (Q3) guidance calls for pro forma revenue growth of 2.9–3.7% (Banking 3–4% as M&A contribution drops ~100 bps; Capital Markets 2.5–3% with ~105 bps M&A), company EBITDA margin expansion of 80–100 bps, and Q3 adjusted EPS growth of 4.6–7.3%; management also reiterated TSYS/Total Issuing synergy targets (> $150M EBITDA benefit by 2028, $125M cost synergies/$45M revenue synergies) and a path to > $3B FCF by 2028.
- Revenue and Earnings GrowthTotal revenue of $3.4B, up 5.3% on a pro forma basis; adjusted EBITDA up 7.4% with margin expansion of 113 basis points; adjusted EPS grew ~8.8%–9%, toward the high end of the range.
- Banking and Payments OutperformanceBanking segment grew 6.1% (Banking 5.6%, Payments 6.4%); recurring revenue +5% and recurring sales +14%; Banking adjusted EBITDA advanced 10.6% with margins expanding 178 basis points driven by favorable mix, cost savings and integration synergies.
- Material Free Cash Flow Improvement and DeleveragingQuarterly free cash flow more than tripled to $525M; first-half FCF ~ $1.0B; trailing 12-month FCF $2.2B. Raised full-year FCF outlook by $100M to $2.15B–$2.25B (midpoint $2.2B), representing ~36% YoY growth at the midpoint. Leverage reduced to 3.5x and $270M returned to shareholders.
- Total Issuing Solutions Acquisition PerformingAcquisition expanded TAM by $28B; renewal momentum with ~1/3 of Total Issuing revenue renewed since start of 2025 and 72% of the portfolio contracted through 2029 (up from 65%); won large clients (top-10 Latin American and top-10 private bank in India); enterprise-wide ACV to joint clients grew 35% YoY in H1.
- Margin Expansion and Cost DisciplineCompany delivered margin expansion driven by product mix and cost savings. Non-GAAP onetime cash expenses reduced by $70M to $730M midpoint (legacy FIS non-GAAP cash expenses down 17% vs original guide). Captured $13M of cost savings YTD and tracking near high end of $30M–$40M full-year synergy target; reiterating >$150M EBITDA benefit by 2028.
- AI Productization and Productivity Gains10 AI products in market, 200 customers live, >500 opportunities in pipeline. Internal productivity: engineering throughput 1.5x–2x and 30% fewer defects; servicing manual tickets down ~70% and triage time down ~75%; 40,000 active AI Copilot users generating >16M assisted actions. Strategic partnership with Anthropic advancing AML and fraud capabilities.
FIS Earnings History
| Report Date | Fiscal Quarter | Forecast / EPS | Last Year's EPS | EPS YoY Change | Press Release |
|---|---|---|---|---|---|
| Feb 16, 2027 | 2026 (Q4) | 3.39- | 1.68 | ― | ― |
| Nov 03, 2026 | 2026 (Q3) | 1.60- | 1.51 | ― | |
| Aug 04, 2026 | 2026 (Q2) | 1.471.48 | 1.36 | 8.82% (+0.12) | |
| May 08, 2026 | 2026 (Q1) | 1.291.36 | 1.21 | 12.40% (+0.15) | |
| Feb 24, 2026 | 2025 (Q4) | 1.691.68 | 1.4 | 20.00% (+0.28) | |
| Nov 05, 2025 | 2025 (Q3) | 1.491.51 | 1.4 | 7.86% (+0.11) | |
| Aug 05, 2025 | 2025 (Q2) | 1.361.36 | 1.36 | 0.00% (+0.00) | |
| May 06, 2025 | 2025 (Q1) | 1.201.21 | 1.1 | 10.00% (+0.11) | |
| Feb 11, 2025 | 2024 (Q4) | 1.361.40 | 0.94 | 48.94% (+0.46) | |
| Nov 04, 2024 | 2024 (Q3) | 1.291.40 | 0.94 | 48.94% (+0.46) |
The table shows recent earnings report dates and whether the forecast was beat or missed. See the change in forecast and EPS from the previous year.
