

Want to see DIOD full AI Analyst Report?
Diodes (DIOD) Q2 2026 Earnings Report
DIOD Q2 2026 EPS Results
- Actual EPS
- $0.70
- Consensus EPS
- $0.63
- Beat/Miss
- Beat by +$0.07
- One Year Ago EPS
- $0.32
DIOD Q2 2026 Revenue Results
- Actual Revenue
- $445.53M
- Expected Revenue
- $436.60M
- Beat/Miss
- Beat by +$8.93M
- YoY Revenue Growth
- +21.66%
Earnings Announcement Details
- Quarter
- Q2 2026
- Date
- 08/05/2026
- Time
- After Close
- Conference Call
- Wednesday, August 5, 2026
Diodes's next earnings date is estimated for November 5, 2026, based on past reporting schedules.
Q2 2026 Earnings Call Audio
Q2 2026 Earnings Slide Deck
Q2 2026 Earnings Call Summary
The call presented strong top-line growth, margin expansion, improving profitability and cash generation, supported by record POS, design wins in automotive and AI/server markets, and an accretive acquisition that broadens the addressable market. Notable risks include reliance on an investment gain in GAAP results, pockets of supply constraints, YoY EBITDA margin percentage compression, elevated inventory to support lead times, and softness in communication/consumer end markets. On balance, the positive operational momentum and strong guidance materially outweigh the highlighted challenges.
Management guided third‑quarter revenue of approximately $510 million ±3% (midpoint implying ~30% year‑over‑year growth and ~14% sequential growth), GAAP gross margin of ~35% ±1% (calling for ~190 basis points of sequential gross‑margin improvement), and non‑GAAP adjusted EPS of $1.05 ±$0.10, while citing an expected ~2.8x year‑over‑year improvement in non‑GAAP earnings and reaffirming three‑year targets of $2.0 billion in annual revenue and >$4 of non‑GAAP EPS. They also said the proposed ElevATE acquisition would be immediately accretive, add about $50 million of revenue in the first 12 months and target >20% revenue CAGR over four years with gross margins well above the corporate average; for context they noted Q2 results of $445.5M revenue (up 22% YoY, 10% sequential), 33.1% gross margin (up 160 bps YoY), EBITDA of $83.5M (18.7% of revenue), free cash flow of $34.8M, cash and short‑term investments of ~$442M, total debt of ~$40M, capex of $33.6M (7.5% of revenue, within a 5–9% target), inventory ≈152 days, and an expected full‑year tax rate of ~18% ±3%.
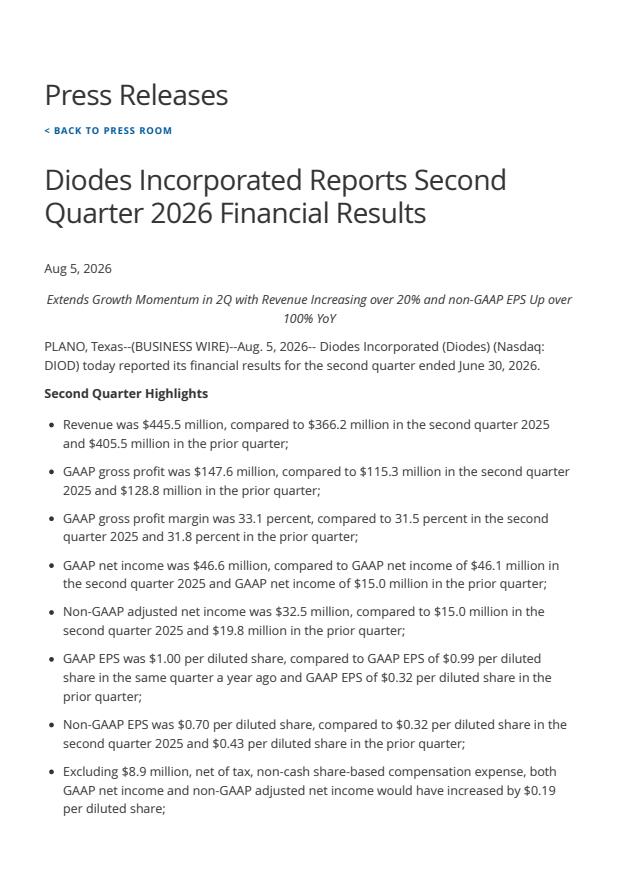
- Strong Revenue GrowthQ2 revenue of $445.5M, up 22% year-over-year (from $366.2M) and up 10% sequentially (from $405.5M). Management forecasts Q3 revenue of ~ $510M (+30% YoY, +14% QoQ at midpoint). This is the fifth consecutive quarter of double-digit YoY growth.
- Gross Margin ExpansionGAAP gross margin expanded to 33.1% in Q2 vs 31.5% a year ago (+160 basis points YoY). Company expects Q3 GAAP gross margin of ~35% (+/-1%) and forecasted a further sequential improvement of ~190 basis points.
- Improved Profitability and Earnings MomentumGAAP net income was $46.6M ($1.00 per diluted share) vs $46.1M ($0.99) prior year and $15M ($0.32) prior quarter. Non‑GAAP adjusted net income was $32.5M ($0.70 per diluted share) vs $15M ($0.32) in Q2 2025 — more than a 100% increase YoY. Non‑GAAP EPS guidance for Q3 is $1.05 (+/- $0.10).
- Record and Strategic End-Market Performance (Automotive & Computing)Automotive reached record levels at 21% of product revenue; automotive revenue grew ~15% sequentially and >37% YoY. Computing (data center/AI servers) held as strongest growth driver: computing revenue +18% sequentially and +33% YoY, with multiple timing/timing-generator design wins and ramping into next‑gen AI server platforms.
- Record Global POS and Channel Inventory ImprovementGlobal POS reached record levels and channel inventory decreased in both dollars and weeks; weeks are now lower than the company’s normal range (11–14 weeks), reducing concerns around double ordering.
- Cash Generation and Healthy Balance SheetOperating cash flow of $68.5M and free cash flow of $34.8M in Q2 (capex $33.6M). Cash, cash equivalents and short-term investments totaled ~$442M; working capital ~$931M; total debt approx. $40M (low leverage).
- Strategic Acquisition to Expand Addressable MarketProposed acquisition of ElevATE Semiconductor (ATE IC specialist) described as immediately accretive: expected to add ~$50M revenue in first 12 months, with revenue forecasted to grow at a >20% CAGR over 4 years and gross margin materially higher than corporate average; management cites product and market synergies and an expanded addressable market (management cites at least ~$1B opportunity).
- Capacity and Manufacturing StrategyCompany reports ~50/50 in‑house vs outsourced production, improving utilization of internal wafer fabs (GFAB and SPFAB), selective internal packaging capacity expansion, and migration from 6-inch to 8-inch wafers to support growth and customers.
DIOD Earnings History
| Report Date | Fiscal Quarter | Forecast / EPS | Last Year's EPS | EPS YoY Change | Press Release |
|---|---|---|---|---|---|
| Nov 05, 2026 | 2026 (Q3) | 1.08- | 0.37 | ― | ― |
| Aug 05, 2026 | 2026 (Q2) | 0.630.70 | 0.32 | 118.75% (+0.38) | |
| May 07, 2026 | 2026 (Q1) | 0.350.43 | 0.19 | 126.32% (+0.24) | |
| Feb 10, 2026 | 2025 (Q4) | 0.280.34 | 0.27 | 25.93% (+0.07) | |
| Nov 06, 2025 | 2025 (Q3) | 0.400.37 | 0.43 | -13.95% (-0.06) | |
| Aug 07, 2025 | 2025 (Q2) | 0.270.32 | 0.33 | -3.03% (-0.01) | |
| May 08, 2025 | 2025 (Q1) | 0.150.19 | 0.28 | -32.14% (-0.09) | |
| Feb 11, 2025 | 2024 (Q4) | 0.360.27 | 0.51 | -47.06% (-0.24) | |
| Nov 07, 2024 | 2024 (Q3) | 0.420.43 | 1.13 | -61.95% (-0.70) | |
| Aug 08, 2024 | 2024 (Q2) | 0.300.33 | 1.59 | -79.25% (-1.26) |
The table shows recent earnings report dates and whether the forecast was beat or missed. See the change in forecast and EPS from the previous year.
