

TerrAscend Corp (TED) Q1 2026 Earnings Report
DE:TED Q1 2026 EPS Results
- Actual EPS
- -EUR 0.03
- Consensus EPS
- -EUR 0.01
- Beat/Miss
- Missed by -EUR 0.02
- One Year Ago EPS
- -EUR 0.04
DE:TED Q1 2026 Revenue Results
- Actual Revenue
- EUR 57.60M
- Expected Revenue
- EUR 58.58M
- Beat/Miss
- Missed by -EUR 979.97K
- YoY Revenue Growth
- -11.75%
Earnings Announcement Details
- Quarter
- Q1 2026
- Date
- 05/07/2026
- Time
- Before Open
- Conference Call
- Thursday, May 7, 2026
TerrAscend Corp's next earnings date is estimated for November 5, 2026, based on past reporting schedules.
Q1 2026 Earnings Call Audio
No earnings call audio is available for this earnings event.
Q1 2026 Earnings Slide Deck
Q1 2026 Earnings Call Summary
The call emphasized strong operational and financial momentum across core markets — notably robust gross margins, expanding adjusted EBITDA margins, consistent positive operating and free cash flow streaks, and improved liquidity — while also acknowledging material GAAP net losses, wholesale revenue softness in select states, and the tail of a challenging Michigan exit and some Ohio execution friction. Strategic tailwinds such as federal rescheduling and potential uplisting were highlighted as important upside catalysts.
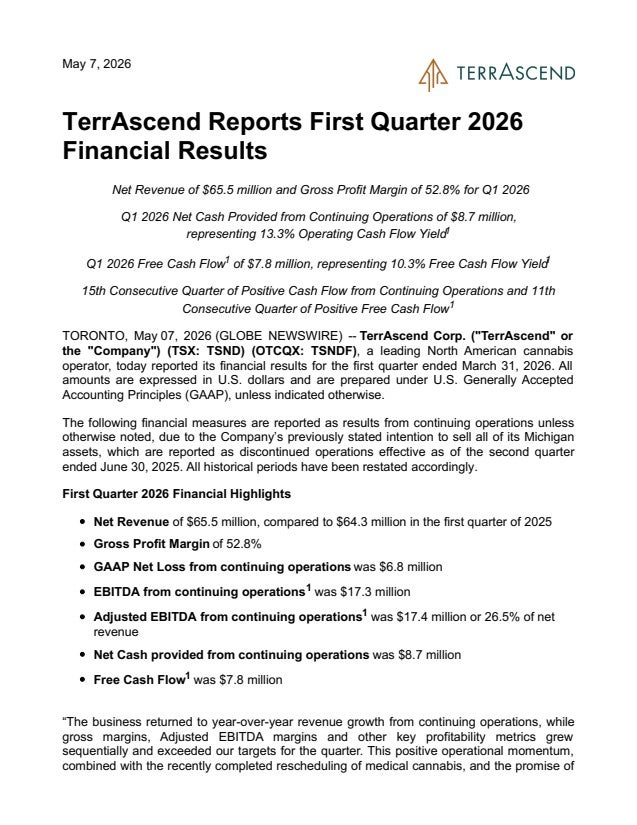
Management guided Q2 year‑over‑year revenue growth of 2–3% and said they expect "consistent strong gross margin performance," while highlighting upside from federal rescheduling (elimination of 280E), potential retroactive tax relief and a possible uplisting within ~12–24 months; they anchored that guidance to Q1 continuing‑ops results of $65.5M revenue, 52.8% gross margin, $17.4M adjusted EBITDA (26.5% margin), $8.7M operating cash flow (15th consecutive quarter), $7.8M free cash flow (11th consecutive quarter), operating cash flow yield 13.3% and free cash flow yield 10.3%, $39.1M cash, $0.9M capex, ~$24.3M free cash flow in the past four quarters, ~85% of Michigan asset sales completed, Maryland at an annualized ~$75M run rate, no material debt maturing until late‑2028, and a $20–30B psychoactive hemp market — all cited as supporting disciplined M&A activity and improved profitability and balance‑sheet flexibility.
- Regulatory Rescheduling BenefitFederal rescheduling of medical cannabis announced — expected elimination of 280E tax burden, potential for improved profitability, stronger balance sheet, lower cost of capital, increased access to institutional capital and potential uplisting to a U.S. exchange; viewed as a transformational upside catalyst for the business.
- Revenue and Return to YoY GrowthNet revenue from continuing operations of $65.5 million in Q1 FY2026. While slightly down sequentially versus Q4 ($66.1 million), management reports a return to year-over-year growth across continuing operations.
- Strong Gross Margin PerformanceGross margin of 52.8% in Q1 versus 52.1% in Q4 — an improvement of ~0.7 percentage points, driven by verticality and operational efficiencies in core markets (New Jersey, Maryland, Pennsylvania).
- Improved Adjusted EBITDA and Margin ExpansionAdjusted EBITDA from continuing operations of $17.4 million, representing a 26.5% margin in Q1 versus $16.7 million (25.2%) in Q4 — an increase of $0.7 million and ~1.3 percentage points in margin sequentially.
- Consistent Positive Cash Flow and LiquidityGenerated $8.7 million of net cash from continuing operations in Q1 (15th consecutive quarter positive operating cash flow) with operating cash flow yield of 13.3%. Free cash flow was $7.8 million (11th consecutive quarter positive free cash flow) with a free cash flow yield of 10.3%. Cash and cash equivalents increased to $39.1 million from $37.4 million (up ~$1.7 million, +~4.5%).
- Strong Market & Brand Execution in Core StatesNotable operational performance: Maryland running at ~ $75 million annualized revenue with high-50s gross margins; New Jersey retail strength including full integration of Union Chill and top-25 store rankings; Pennsylvania delivered YoY revenue growth for the 4th consecutive quarter with multiple Apothecarium locations ranking top statewide and record finished goods/unit sales for TerrAscend SKUs. Brand momentum: Kind Tree and Legend driving growth, Legend vape sales grew 'double digits'.
- Progress on Michigan Exit and Balance Sheet RepairApproximately 85% of Michigan asset sales completed; liabilities and debt significantly negotiated down; proceeds primarily used to pay down debt; exit now in final stage via receivership to further mitigate liabilities.
- Discipline on G&A and Capital AllocationG&A reduced to $21.5 million (32.8% of revenue) from $22.8 million (34.4% of revenue) sequentially — a reduction in both absolute dollars (~$1.3 million) and as a percentage of revenue. Capital expenditures were modest at $0.9 million for the quarter.
DE:TED Earnings History
| Report Date | Fiscal Quarter | Forecast / EPS | Last Year's EPS | EPS YoY Change | Press Release |
|---|---|---|---|---|---|
| Nov 05, 2026 | 2026 (Q3) | -0.02- | -0.04 | ― | ― |
| Aug 06, 2026 | 2026 (Q2) | -0.01-0.03 | -0.03 | 0.00% (+0.00) | |
| May 07, 2026 | 2026 (Q1) | -0.01-0.03 | -0.04 | 40.00% (+0.02) | |
| Mar 12, 2026 | 2025 (Q4) | -0.010.01 | -0.1 | 109.09% (+0.11) | |
| Nov 06, 2025 | 2025 (Q3) | -0.02-0.04 | -0.07 | 50.00% (+0.04) | |
| Aug 07, 2025 | 2025 (Q2) | -0.02-0.03 | -0.03 | 0.00% (+0.00) | |
| May 08, 2025 | 2025 (Q1) | -0.03-0.04 | -0.05 | 16.67% (+0.01) | |
| Mar 06, 2025 | 2024 (Q4) | -0.03-0.10 | -0.16 | 38.89% (+0.06) | |
| Nov 06, 2024 | 2024 (Q3) | -0.03-0.07 | -0.02 | -247.83% (-0.05) | |
| Aug 08, 2024 | 2024 (Q2) | -0.02-0.03 | -0.04 | 40.00% (+0.02) |
The table shows recent earnings report dates and whether the forecast was beat or missed. See the change in forecast and EPS from the previous year.
